In stock markets and the crypto sector, traders are always looking for a definite reason to explain an asset’s price action, which means it’s important to stress that correlation doesn’t imply causation.
While it may be easy to connect a regulatory statement or pending legislation to the outcome of an asset’s price, there’s not always hard proof that these were the exact drivers. Some indicators described below may have happened due to pure luck, even if the coincidence continues throughout history.
For example, Bitcoin’s (BTC) pump to $48,200 on Oct. 1 could have been related to the Sept. 30 remarks by the U.S. Federal Reserve chairman Jerome Powell. When asked to clarify his comments on Central Bank Digital Currencies (CBDC), Powell affirmed that the FED has no intentions to ban cryptocurrencies.
Another plausible reason for the current rally is Bitcoin’s 7-day average hash rate jumping to 145 exahashes per second (EH/s), its highest level since the abrupt crash in early June when China’s mining crackdown intensified.
Finally, increasing expectations of a Bitcoin exchange-traded fund (ETF) approval by the U.S. Securities and Exchange Commission (SEC) might have played an essential part in traders’ recent bullish bets.
What is clear is that multiple factors could have led last week’s pump to $49,000, and today bulls appear to be making an effort to recapture $50,000. So let’s take a look at 3 indicators that flashed a ‘buy’ signal ahead of the recent price move.
UNI caught a bid after traders turned their attention to DeFi
Uniswap (UNI, left) vs. Bitcoin (BTC, right). Source: TradingView
UNI, the decentralized exchange token for Uniswap, pumped a few hours ahead of the Oct. 1 market rally. The altcoin began its price increase right as the UTC monthly close happened, initially by 5% to $24.20 from $23. This move was followed by another 4% pump to $25.20 three hours ahead of Bitcoin’s breakout above $45,000.
Curiously, DEX volumes started to soar after China imposed additional restrictions on Bitcoin in the previous week. A reasonable explanation for the move could be investors beginning to understand that China’s action would not impact the trading volume. By migrating to DEX, the possibility for governments to control or limit cryptocurrency adoption goes down significantly.
Shorts on derivatives exchanges saw an uptick
Some exchanges provide useful information on clients’ net exposure by measuring their positions or consolidating data from spot and derivatives markets. For example, the OKEx Bitcoin traders’ long-to-short ratio dropped from 1.25 (favoring longs) to 0.72 (favoring shorts) by 28% in less than two days.
That might sound counterintuitive at first, showing whales increasing bearish bets, but when market expectations are broken, extreme price moves tend to happen. Had most traders expected a positive price swing, the result would likely have been priced in already.
Regardless of the underlying asset, a futures contract has longs (buyers) and shorts (sellers) matched at all times. This means there is no way to anticipate whether those investors are skewed to either side.
However, sudden increases in the open interest, which reflects the aggregate number of contracts still in play, reflects confidence. The higher the notional involved, the bigger the stakes.
Binance Bitcoin futures open interest. Source: Binance
Notice how, during the 4 hours ahead of the 6:00 am UTC bull run, the spike on both the USDT perpetual and the coin-based contract open interest. Interestingly, even with the $400 million additional bets, Bitcoin price was only noticeably impacted after the open interest peaked.
The truth is one might never uncover what exactly triggered the rally, but by monitoring similar patterns in the future, traders may be able to predict price pumps. Of course, there’s no guarantee that all three indicators will repeat themselves, but the cost of monitoring the data is minimal.
The views and opinions expressed here are solely those of the author and do not necessarily reflect the views of Cointelegraph. Every investment and trading move involves risk. You should conduct your own research when making a decision.
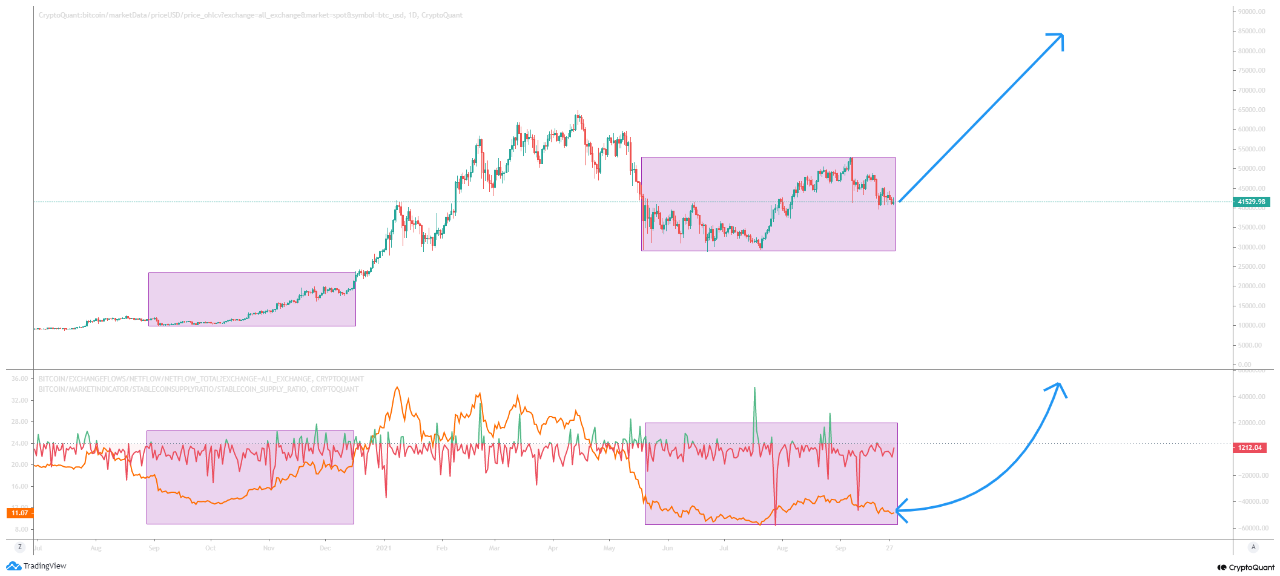
Quant says some Bitcoin indicators show the same trend as in during Q4 2020, suggesting that BTC could make a similar move up.
Bitcoin Netflow And Stablecoins Supply Ratio Trends Look Similar To Q4 2020
As explained by an analyst in a CryptoQuant post, two BTC indicators: the netflow and the stablecoins supply ratio, are both trending similarly to how they did during the last quarter of 2020.
The Bitcoin netflow indicator shows the net number of coins entering or exiting exchanges. Its value is calculated by taking the difference between the outflows and the inflows.
When the metric observes positive values, it means exchanges are experiencing more inflows than the outflows, and so more investors have started sending their BTC to exchanges for selling purposes.
Similarly, negative values imply just the opposite; investors are withdrawing their Bitcoin from exchanges either to hodl in personal wallets or to sell them through OTC deals.
The other metric of relevance is the stablecoins supply ratio, which is defined as the market cap of BTC divided by the market cap of all stablecoins.
When the indicator’s values are on the lower end, it means there is an abundance of stablecoins supply in the market. High supplies can imply a potentially bullish sentiment among the market as investors use these coins for picking up other crypto like BTC.
Related Reading | China’s Ban On Crypto-Assets Forces Huobi Mining Pool To Rotate 100k Bitcoin
On the other hand, higher values of the ratio indicate a low supply of stablecoins, which implies a lack of buying pressure in the market. This could lead to a potentially bearish trend or sideways movement for BTC.
Now, here is a chart showing the trend of these two Bitcoin indicators vs the price:
The similarity between Q4 2020 and the current period | Source: CryptoQuant
As the above chart shows, the netflows seem to have been negative for a while now and the stablecoins supply ratio is also assuming low values.
Related Reading | Bitcoin Bearish Signal: On-Chain Data Shows Whales Have Started Selling
This trend looks to be similar to how it was during Q4 2020. What followed it was a big bull rally, and so the quant believes we may see BTC blow up similarly soon.
BTC Price
At the time of writing, Bitcoin’s price floats around $43k, down 2% in the last seven days. Over the past month, the crypto has lost 9% in value.
Over the last few days, BTC has only shown sideways movement as the crypto fails to make a move above $45k. The below chart shows the trend in the price of the coin over the last five days:
BTC's price continues to consolidate between the $40k and $45k levels | Source: BTCUSD on TradingView
Featured image from Unsplash.com, charts from CryptoQuant.com, TradingView.com
Data from Cointelegraph Markets Pro and TradingView showed BTC/USD losing $43,000 following the news after hitting local highs above $43,800 on Bitstamp.
With the source of the issue unknown at the time of writing, traders were left in the dark as an already sensitive crypto market fell back towards es
“We are investigating issues with the platform and have to temporarily halt trading,” Bitfinex wrote as part of its latest service update.
We are investigating issues with the platform and have to temporarily halt trading. We will keep everyone updated on here and our status page https://t.co/u3pYCVVGQq as we know more. We apologise for the inconvenience.
Tuesday had seen fellow exchange Binance, the largest by volume in the world, suspend trading for two hours as part of scheduled maintenance, this having no significant impact on BTC price action.
With Thursday already set to be a charged day, however, Bitcoin looked set to close out September almost exactly at its predicted “worst case scenario” price of $43,000.
In so doing, the largest cryptocurrency would once again validate predictions made by stock-to-flow model creator PlanB, who also correctly estimated the August close of $47,000.
Fellow trader and analyst Rekt Capital meanwhile reiterated the need for BTC/USD to reclaim its 21-week exponential moving average level (EMA) by the end of Sunday to preserve overall bullish momentum.
Market mimics $10,000 BTC from September 2020
Meanwhile, the overall character of the Bitcoin market was still far from bearish for most.
Related: Bitcoin breaking new highs in Q4 will ‘temporarily turn alts to dust’ — Analyst
Despite lackluster price action, the odds remain for a dramatic return to form in the coming weeks and months, with comparisons to the same period in 2020.
The latest was from Cole Garner, who noted that the large block of buyer support just below $40,000 was reminiscent of the order book setups when BTC/USD was at $10,000 in September last year.
This week also saw long-time pundit Bobby Lee predict not only $100,000 in the mid term, but as much as $200,000 or more for Bitcoin in a new “FOMO rally.”
After what looked to be a month of prosperity following the August bull run, Bitcoin has now entered into an era of increasingly bearish signals. The asset had seen a number of rallies that pushed it over two-month highs, successfully breaking above the $52K resistance range on a number of occasions. Throwing the entire market into a stretched-out period of positive sentiment.
September has now come with its own unique set of problems for the digital asset. Bitcoin price has been suffering since the beginning of the month, ushered in with a flash crash that rocked the market only a week into September. The market continues to suffer from the aftershock of this flash crash, which has left a trail of blood in the market, and led to massive liquidations.
Related Reading | Just 10 Days After El Salvador’s “Bitcoin Day”, President Bukele Confirms 1.1 Million Citizens Have Chivo Wallet
Bitcoin Price Crash Leads To Sell-Offs
In only a matter of days, the price of bitcoin has fallen from $47,000 to $40,000, which triggered liquidations in the market. The long liquidations totaled up to the tune of $860 million across exchanges. The liquidations took place over two days when the price of the digital asset had inevitably fallen to $40,000 on Tuesday, September 21st. Although significant, the liquidations, which were spread across two days, still sat below the sell-offs seen following the September 7th crash.
Related Reading | Did Bitcoin Really Experience A Flash Crash Down To $5,400?
Monday marked the beginning of the liquidations as the market saw $470 million long positions liquidated. And the following Tuesday, a total of $390 million long positions were liquidated as well. At this point, the price of bitcoin had hit levels not seen since mid-August. And as market sentiment shifted into the negative, the price continued to plunge.
BTC longs liquated on Monday and Tuesday add up to $860 million | Source: Arcane Research
Current sell-off volumes have remained beneath the $1.2 billion sell-off in early September, suggesting that this current sell-off is more organic than previous ones. Also, it shows that the current market is more influenced by spot activity compared to the derivatives market.
September And Its Chokehold On The Market
September has historically come with challenges for the crypto market. So the crash that rocked bitcoin and the entire market at the beginning of the month is on-brand. Crashes with at least a 17% value loss have happened in September for the past four years and it looks like 2021 has fallen in line with this trend.
However, the end of September has always come with better forecasts for the following month. Chart analysis show crashes in the month precede recoveries that put the market on course to regain its lost value. Setting the market up for another bull run.
BTC price trading north of $43K | Source: BTCUSD on TradingView.com
The price of BTC has now recovered above its Tuesday’s lows, which saw the digital asset plunge below $40K. Bitcoin is currently trading above $42,000 at the time of writing. While the total market cap has fallen below $800 billion.
Featured image from Bitcoin News, charts from Arcane Research and TradingView.com
One of the reasons behind Bitcoin’s (BTC) volatility, the substantial price oscillations that occur regularly, is the discrepancy of its use cases. Some pundits deem it “digital gold,” a truly scarce and perfect store of value (SoV). Others consider Bitcoin a technology project or a type of software with a corresponding network.
El Salvador’s adoption as legal tender will likely evidence the means of exchange (MoE) functionality that the Lightning Network provides. The Layer-2 scaling solution allows instant and insanely cheap transfers, although it requires regular on-chain transactions to enter or exit this parallel network.
As these narratives about Bitcoin shift over time, so does BTC’s correlation to traditional assets. For example, there have been sustained periods of a strong correlation with gold.
Bitcoin vs. gold (precious metal) in 2020. Source: TradingView
The March 2020 crash was devastating for almost every asset class, but the recovery pattern that followed those six or seven months was virtually identical for gold and Bitcoin. Curiously, the opposite movement occurred in 2021, displaying an inverse correlation between the two assets.
Is Bitcoin a tech stock proxy?
On the other hand, Bitcoin started to mimic the Hong Kong stock market, as measured by the Hang Seng Index (HSI). Among its top constituents are Tencent, Alibaba, and Meituan, which are billion-dollar Asian technology companies.
Bitcoin vs. Hang Seng Index (stocks). Source: TradingView
This shift in investors’ perspective — from tracking gold price to tech stocks — begs one the question of whether Bitcoin will succumb to the Hang Seng downward movement seen in the past 90 days. Does it make sense to decouple right now? If so, will Bitcoin continue to act as a safe haven amid a general correction?
On Sept. 14, China’s second-largest property developer, Evergrande Group, announced that a significant decline in sales forced the company to postpone payments over its debt. This single company has over $300 billion in liabilities, which and according to analysts this could severely impact the broader market.
In August, China’s retail sales disappointed at 2.5% versus the previous year, where investors expected a 7% growth rate. Obviously, growth and the economy were heavily impacted in 2020 by governments’ reaction to the Covid-19 outbreak.
However, one must consider that the most influential Central Banks have been practicing near zero or even negative interest rates since the Q1 of 2020. Thus, if the economy fails to gain momentum amid multiple trillion-dollar stimulus packages, there’s not much that can be done to prevent a generalized stock market correction and potential losses on debt markets.
The problem is: Bitcoin might be 12 years old, but it has never faced a significant economic crisis, at least nothing that puts the $250 trillion-plus global debt markets at risk. Therefore, any analysis or estimate will unlikely yield a credible assessment.
Bitcoin might be less impacted by a market meltdown
However, the cryptocurrency has an edge over traditional markets like commercial real estate, stocks, and bonds. Lenders will foreclose on these assets if clients default on their payments, and this adds further pressure because the bank or institution has no interest in keeping them.
On the other hand, generally speaking, Bitcoin and cryptocurrencies cannot be used as collateral.
Regarding the billion-dollar Bitcoin futures liquidations on derivatives markets, those are just synthetic instruments. Undoubtedly these events will impact the price, but at the end of the day, the effective BTC stays at the derivatives’ exchange. It solely moves from the long (buyer) balance to the short (seller) account.
Until Bitcoin becomes fully entrenched in financial markets and accepted as collateral and deposits, the mid-term systemic risk for the cryptocurrency is lower than the traditional market.
The views and opinions expressed here are solely those of the author and do not necessarily reflect the views of Cointelegraph. Every investment and trading move involves risk. You should conduct your own research when making a decision.
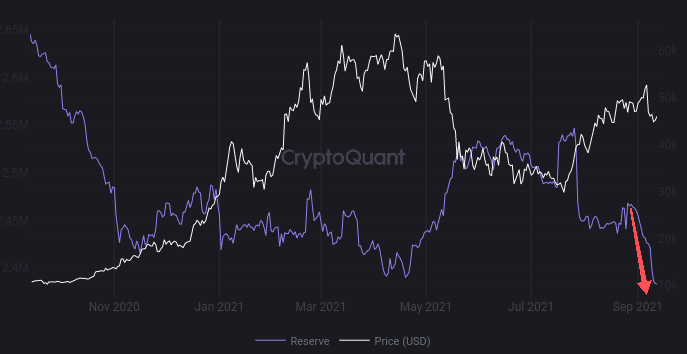
On-chain data shows Bitcoin exchange reserves have hit the lowest value in 3 years, here’s what it might mean for BTC’s price.
Bitcoin Exchange Reserves Lowest In 3 Years As Negative Netflows Continue
As pointed out by a CryptoQuant post, exchange reserves have been continuing their downtrend, and have now reached lows not seen since 3 years ago.
The all exchanges reserve is an indicator that shows the total amount of Bitcoin held in wallets of all centralized exchanges.
An increase in the metric’s value suggests more investors are depositing their coins for withdrawing to fiat or altcoin purchasing. On the other hand, a decrease means more buyers are moving their BTC to personal wallets for hodling or OTC deals.
Here is the latest chart for the Bitcoin all exchanges reserve:
The BTC all exchanges reserve plunges down
As the above graph shows, the value of the indicator has sharply gone down recently. The current level of the metric is the lowest it has been in the last three years.
As already mentioned before, a downtrend like this one means investors are withdrawing their coins from exchanges possibly to hodl or sell through OTC deals.
Related Reading | Indicators Show Bitcoin Might Be Gearing Up For One Last Push Up
Such values are typically bullish in the long-term as they may mean that there are more long-term holders in the market who are hodling out of exchanges.
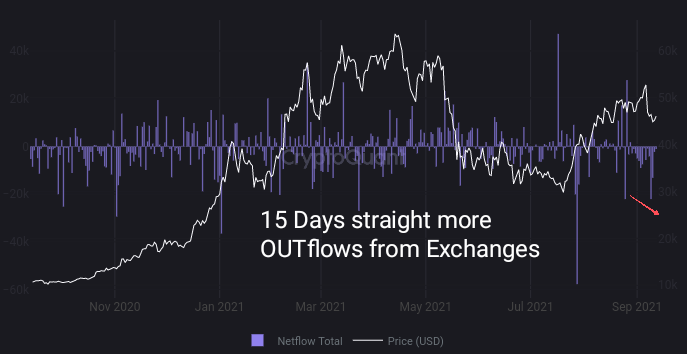
There is another relevant indicator here, called the Bitcoin netflow, which shows the net amount of BTC entering or exiting exchanges.
A positive spike in the chart for the exchange netflows means exchanges are observing more inflows compared to the outflows. A negative value implies just the opposite.
Big spikes or a prolonged period of smaller spikes in one direction can affect the value of the exchange reserves. Naturally, positive values can increase the reserve while negative ones can decrease it.
Related Reading | Ukraine Adopts New Law To Legalize Bitcoin And Other Cryptocurrencies
The below chart shows the current trend for the exchange netflows:
The BTC netflows show big negative spikes
As expected, the netflows have been negative recently, leading to the low values of the Bitcoin exchange reserves.
What Could It Mean for BTC’s Price?
As mentioned earlier, a downtrend in the exchange reserves can be bullish for the price in the long-term as it may imply a greater amount of long-term holdings. This has also been usually true historically, but there can be certain exceptions.
However, looking at the current Bitcoin price movement, it looks like selling has been going on. But as the exchange reserves haven’t shot up (unlike the crash from the May ATH), sales are being done likely through OTC deals.
Now, depending on if most of the outflows are being done to sell through OTC deals, a bearish picture can be there instead.
BTC's price continues to decline | Source: BTCUSD on TradingView
Featured image from Unsplash.com, charts from TradingView.com, CryptoQuant
Some Bitcoin indicators show similarities between the post-ATH price action and current trend, implying that there will be one last push up before a bigger drop.
Indicators Might Show Today’s Price Action Is Similar To That After $64.5k ATH
As explained by a CryptoQuant analyst, there seem to be many similarities between the Bitcoin indicators of the post all-time-high (ATH) period and that of present day.
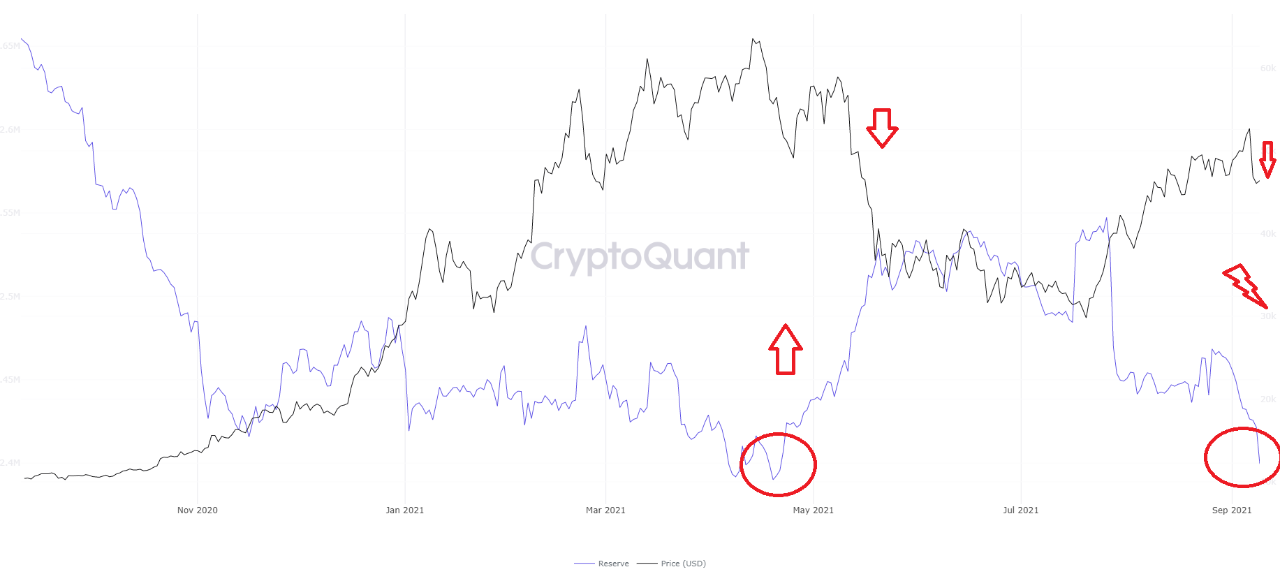
There are three main metrics of relevance here. The first is the exchange reserve, which shows the amount of BTC currently being held on centralized exchange wallets.
Here is how this indicator’s value has changed during the past year:
The BTC exchange reserve after the ATH vs today
Looking at the above graph, there does seem to be a similarity between the two periods. Both had declining prices as well as declining exchange reserves.
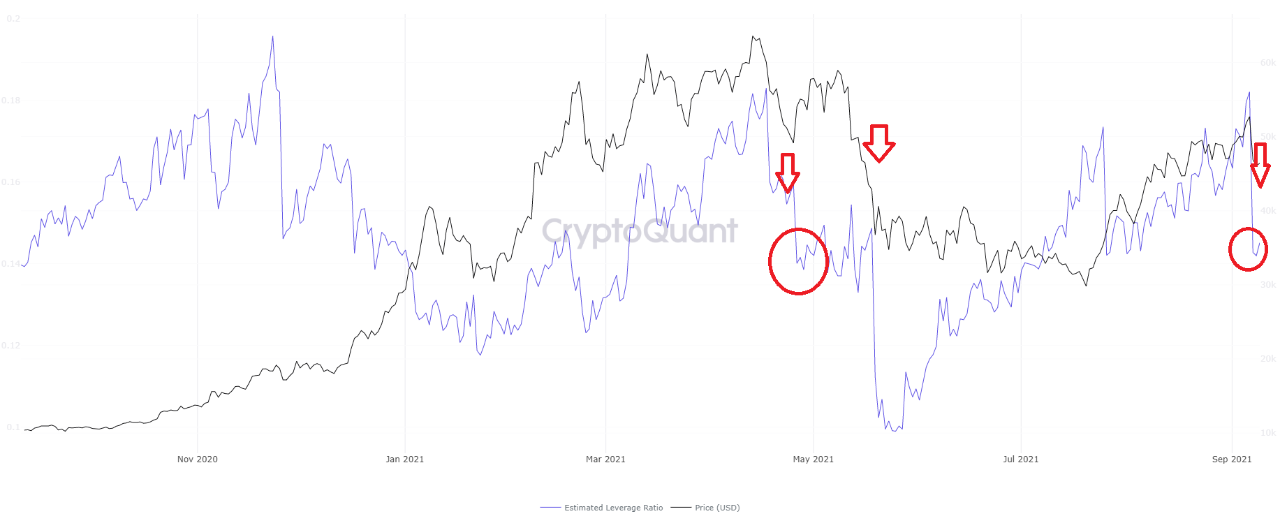
Next is the estimated leverage ratio, an indicator that shows how much leverage is used by traders on average. It’s calculated by taking the open interest divided by the exchange reserve.
The leverage ratio seems to be plunging down
Here too a similarity can be seen as the indicator seems to have sharply dropped down during both present day and the post-ATH period.
Related Reading | Why This Investor Fled His Bitcoin Position, Should You Do The Same?
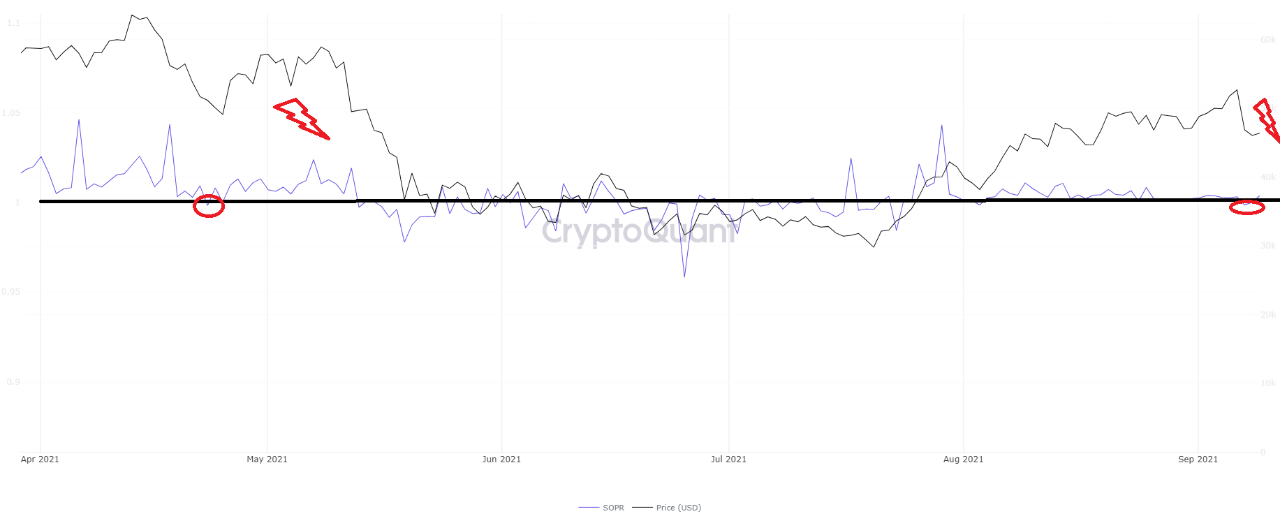
Finally, there is the Spent Output Profit Ratio (SOPR), which is calculated by taking the ratio of realized value (in USD) to the value of creation of a spent output.
In simpler terms, the indicator shows whether Bitcoin wallets are selling their coins at a profit or a loss. The below chart shows the trends for this metric.
The BTC SOPR over the past six months
Looks like the value of the SOPR dropped down below 1 during both these periods. Such a value indicates that investors have been selling BTC at a loss (while values above 1 would imply the opposite).
Related Reading | Bitcoin Price “Pitchfork Channel” Could Pin-Point The Last Dip Ever
If the current trend really is similar to the post-ATH one as these indicators would seem to imply, then it means BTC’s price might move up soon and make a local peak. And just like last time, a big drop could happen after that which takes the price to lower levels. So that this uptrend could turn out to be the last move up for a while.
BTC Price
At the time of writing, Bitcoin’s price floats around $45.7k, down 10% in the last 7 days. Over the past month, the cryptocurrency has dropped 1% in value.
Here is a chart showing the trend in the price of the coin over the last three months:
Bitcoin's price moves sideways after a big plunge downwards | Source: BTCUSD on TradingView
Featured image from Unsplash.com, charts from TradingView.com, CryptoQuant
Bitcoin price broke the key $52,000 resistance zone against the US Dollar. BTC remains supported and it could continue to climb higher towards $55,000.
Bitcoin started a fresh increase above the $51,500 and $52,000 resistance levels.
The price is now trading above $52,000 and the 100 hourly simple moving average.
There is a key bullish trend line forming with support near $52,250 on the hourly chart of the BTC/USD pair (data feed from Kraken).
The pair could dips a few points, but it might find support near $52,250 and $52,000.
Bitcoin Price Extends Gains
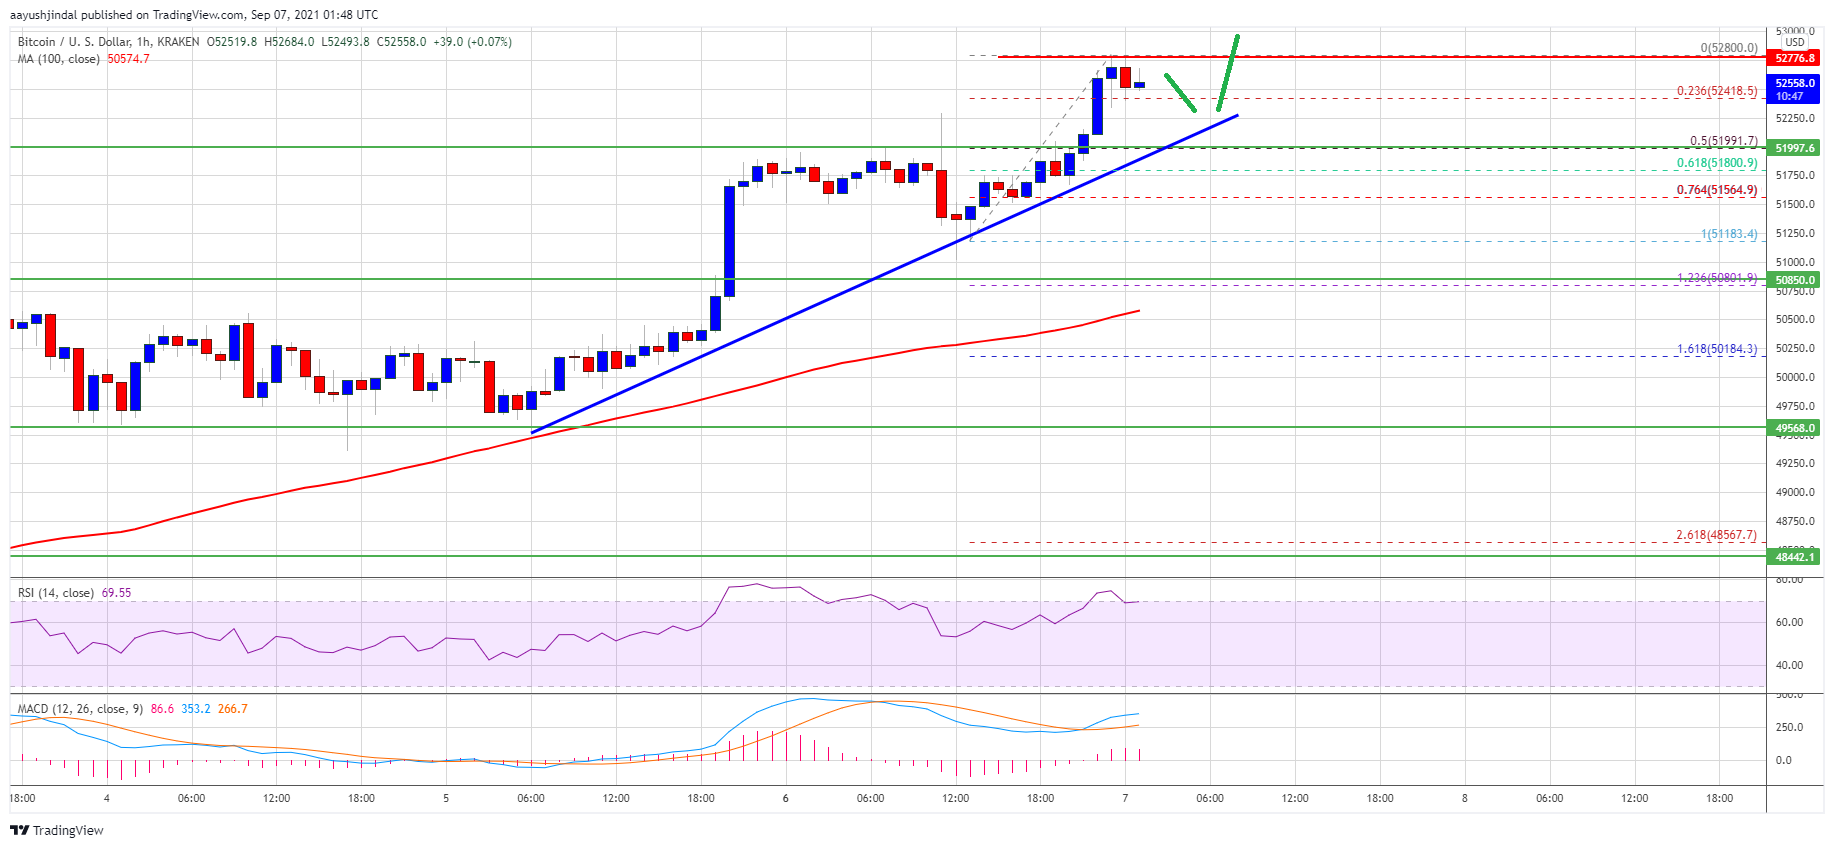
Bitcoin price consolidated above the $51,000 zone for some time before starting a fresh increase. BTC broke the key $52,000 resistance zone and the 100 hourly simple moving average to move further into a positive zone.
The price even broke the $52,500 resistance and traded as high as $52,800. It is now trading well above $52,000 and the 100 hourly simple moving average. An immediate support is near the $52,400 level. It is near the 23.6% Fib retracement level of the recent increase from the $51,183 swing low to $52,800 high.
The next support could be near the $52,250 level. There is also a key bullish trend line forming with support near $52,250 on the hourly chart of the BTC/USD pair.
Source: BTCUSD on TradingView.com
The main support is now forming near the $52,000 level. It is close to the 50% Fib retracement level of the recent increase from the $51,183 swing low to $52,800 high. If there is a downside break below the $52,000 support zone, the price could extend its decline. In the stated case, the price could test the $50,850 support or the 100 hourly SMA.
More Upsides In BTC?
If bitcoin stays above the $52,000 support zone and the trend line, it could rise further. An immediate resistance on the upside is near the $52,650 level.
The first major resistance is near the $52,800 level. A close above the $52,800 level could pump the price further in the near term. The next major hurdle for the bulls could be near the $53,500 zone. Any more gains could lead the price towards the $54,200 level.
Technical indicators:
Hourly MACD – The MACD is slowly gaining pace in the bullish zone.
Hourly RSI (Relative Strength Index) – The RSI for BTC/USD is well above the 60 level.
Major Support Levels – $52,250, followed by $52,000.
Major Resistance Levels – $56,650, $52,800 and $53,500.
Perfect timing and place for a Lightning Network Conference. In less than a week, Bitcoin will be legal tender in El Salvador. The Lightning Network was instrumental for this to happen. The real-life case study for the Lightning Network is El Zonte AKA Bitcoin Beach. And in Mid-November, all of those factors will collide in an event aptly titled “Adopting Bitcoin.”
Related Reading | How Big Is Bitcoin’s Lightning Network? The Answer Will Surprise You
This Lightning Network conference comes with a call-to-action as its unofficial slogan, “Unite, focus, collab!” And, by the looks of Adopting Bitcoin’s official Twitter, the tribe responded to the call and will attend en masse.
Unite, focus, collab! ⚡⚡⚡
“Adopting Bitcoin – A Lightning Summit 2021” #adopt21 brings together the Bitcoin and Lightning communities in El Salvador this November
The focus: transitioning 6+ million people onto the Lightning Network!
What Characteristics Does This Lightning Network Conference Have?
According to “Adopting Bitcoin‘s” website, their purpose:
“… is bringing together the Bitcoin and Lightning community in San Salvador and El Zonte to create connections and foster the future of money and payments in the Central American republic.”
The Lightning Network Conference has the following characteristics:
The team behind the Bitcoin Beach Wallet, Galoy, produced the conference.
“Adopting Bitcoin” is a not-for-profit event.
The organizers will donate 100% to support Lightning Network development.
The Lightning Network conference will be both in English and in Spanish.
“Adopting Bitcoin” will be live-streamed.
They’ll dedicate Tuesday and Wednesday to hard-core conferencing.
Thursday they’ll finish the peregrination by visiting the place that started it all, El Zonte. “We will have an organized Bitcoin Bazaar 10a-4p…. with kiosks, stands and food stalls anchored at / near Hope House,” said Galoy’s Co-Founder.
Tuesday and Wednesday are full conference days in San Salvador.
Thursday is more casual in El Zonte. We will have an organized Bitcoin Bazaar 10a-4p…. with kiosks, stands and food stalls anchored at / near Hope House.
The Lightning Network conference is for “early adopters only.” Tickets can only be purchased with bitcoin over the Lightning Network.
“Adopting Bitcoin” is for “developers, businesses and general enthusiasts to network and form in-person connections.”
Adopting Bitcoin: Lightning Summit in El Salvador. Dates: 16 – 18 November 2021. Tickets can only be paid on the #Bitcoin#LightningNetwork. All proceeds of the conference will be donated to the development of the Lightning Network. https://t.co/vZzQb6MOy9 pic.twitter.com/ivizhyD960
— Bitcoin LightningNetwork+ News ⚡️ (@BTC_LN) August 30, 2021
“Adopting Bitcoin’s” Line Up
Tuesday and Wednesday, the party is in San Salvador’s Sheraton Presidente. Both days contain “Lightning 101” workshops. Among the star lecturers are:
Alex Gladstein, Chief Strategy Officer at the Human Rights Foundation; podcaster extraordinaire Stephan Livera; Bitnob’s Bernard Parah, from Nigeria, one of the protagonists of this historic transaction; “Bitcoin En Español’s” host Camila Campton; Mónica Taher, Tech & Economic International Affairs for El Salvador; Bitcoin Beach’s Mike Peterson, and Paxful’s Ray Youssef.
Full line-up in the Lightning Network Conference ‘s website.
On Thursday 18, the party moves to El Zonte and ends with a literal Taproot Activation Party in El Tunco. For a video tour of both towns, check this mini-documentary out.
BTC price chart for 08/31/2021 on Cexio | Source: BTC/USD on TradingView.com
About Galoy, Organizers Of The Lightning Network Conference
According to their official website, “Galoy offers easy to use Bitcoin ‘Banking-as-a-Service’ (BaaS) products.” They are responsible for the self-referential official wallet for the Bitcoin Beach project. “In October 2020, we launched our branded “Bitcoin Beach” Lightning Wallet in El Zonte.” Galoy describes itself as:
“… a B2B company, serving organizations that embrace Bitcoin as money. We build on the Bitcoin Protocol and the Layer 2 Lightning Network, utilizing the tools created by the team at Lightning Labs.”
Related Reading | Are The Lightning Network’s Almost-Free Transactions The Killer App BTC Needed?
And now, they’re contributing to the Bitcoin ecosystem with this not-for-profit Lightning Network Conference in El Salvador. One that requires that you actually use the novel network to purchase the coveted ticket. And donates all proceeds to Lightning development.
Nice.
Featured Image: Adopting Bitcoin's logo | Charts by TradingView
This report updates on what 0xB10C, Coinbase Crypto Community Fund grant recipient, has been working on over the first half of his year-long Bitcoin development grant. This specifically covers his work on Userspace, Statically Defined Tracing support for Bitcoin Core.
By 0xB10C, Coinbase Bitcoin developer grant recipient
The reference implementation to the Bitcoin protocol rules, Bitcoin Core, is the most widely used software to interact with the Bitcoin network. Bitcoin Core is, however, a black box to most users. While information can be queried via the RPC interface or searched in the debug log, there is no defined interface for real-time insights into process internals. Yet, some users could benefit from more observability into their node. Hobbyists and companies running Bitcoin Core in production want to include their nodes in their real-time monitoring. Developers need visibility into test deployments to evaluate, review, debug, and benchmark changes. Researchers want to observe and analyze the behavior of nodes on the peer-to-peer network. Exchanges and other services handling large sums of bitcoin want to detect attacks and other anomalies early.
Peeking inside with Userspace, Statically Defined Tracing
The eBPF technology present in the Linux kernel can be used for observability into userspace applications. The technology allows running a small, sandboxed program in the Linux kernel, which can hook into predefined tracepoints in running processes. Once hooked into a tracepoint, the program is executed each time the tracepoint is reached. Tracepoints can pass data, for example, application state. Tracing scripts can further process the data. The practice of hooking into tracepoints in userspace applications is known as Userspace, Statically Defined Tracing (USDT). For example, these tracepoints are also included in PostgreSQL, MySQL, Python, NodeJS, Ruby, PHP, and libraries like libc, libpthread, and libvirt.
The static tracepoints can be leveraged by Bitcoin Core users wishing for more insights into their node. Adding USDT support did not require intrusive changes, and no custom tooling had to be written. When not used, the performance impact of the tracepoints is minimal to non-existent. Only privileged processes can hook into the tracepoints, no information leaks to other processes on the host. These properties make Userspace, Statically Defined Tracing a good fit for Bitcoin Core.
For example, I placed two tracepoints in the peer-to-peer message handling code of Bitcoin Core. For each inbound and outbound P2P message, the tracepoints pass information about the peer, the connection, and the message. This data can be filtered and processed by tracing scripts. As a demo, I have built a P2P Monitor that shows the communication between two peers in real-time. Users can find this script alongside other USDT examples in the contrib/tracing/ directory of the Bitcoin Core repository.
body[data-twttr-rendered=”true”] {background-color: transparent;}.twitter-tweet {margin: auto !important;}
Use-cases for Userspace, Statically Defined Tracing
I list some use-cases for Userspace, Statically Defined Tracing I have thought about or worked on. With only three tracepoints merged, there is plenty of room for developers to add new tracepoints and get creative with tracing scripts. Issue #20981 contains discussion and ideas for additional tracepoints that can be implemented.
Researchers and developers can use the P2P message tracepoints to monitor P2P network anomalies in real-time. One example could be detecting the recent addr message flooding as reported in this bitcointalk.org post. The messages were announcing random IP addresses not belonging to nodes on the Bitcoin network. The flooding has been covered in detail by Grundmann and Baumstark. They discuss that the attacker could obtain the number of connected peers and learn about other addresses, including Tor addresses, the node is listening on. This would reduce the privacy of the node operator. It’s important to stay vigilant to these attacks, discuss them, and then, if needed, react to them.
Similarly, I have been instrumenting the Bitcoin Core network address manager with tracepoints. The addrman keeps track of gossiped network addresses for potential outbound peers connections a node makes. It’s designed to be resiliant against Eclipse Attacks, where a node only has connections to peers controlled by the attacker. The attacker can choose which information to feed to the node, enabling, for example, double-spending attacks. Information about the addresses in the addrman might help detect the build-up of an eclipse attack when combined with other data.
Additionally, these addrman tracepoints can be helpful during debugging and code review. To showcase this, I build a tool that visualizes the addresses in the addrman data structure based on the data submitted to the tracepoints.
body[data-twttr-rendered=”true”] {background-color: transparent;}.twitter-tweet {margin: auto !important;}
A Prometheus metric exporter can also build on top of the tracepoints without requiring additional code in Bitcoin Core. There already exist RPC-based Prometheus exporters and projects like Statoshi. However, RPC-based exporters are limited by the information exposed via the RPC interface, and Statoshi is large a patch-set that requires maintenance on each Bitcoin Core release. I have published an experimental USDT-based exporter called bitcoind-observer that hooks into the three currently merged tracepoints and serves metrics in the Prometheus format. The exporter can be used by everyone currently running a Bitcoin Core node compiled with USDT support. A demo is available on bitcoind.observer.
The already existing tracepoint validation:block_connected can be used to benchmarking block validation. This allows, for example, to compare the initial block download performance between different patches and can aid in detecting performance improvements and regressions. For example, the bitcoinperf project might benefit from such tracepoints. I’ve used the tracepoint to benchmark Martin Ankerls pull request #22702. If merged, the changes he proposes would result in a substantial block validation speed up and reduction in memory usage.
Next steps
I will collect further ideas for tracepoints and implement them alongside example tracing scripts and more tooling. This will also involve communicating with other Bitcoin and Bitcoin Core developers about which tracepoints could be helpful in their projects. An example is Antoine Riard’s cross-layer anomaly detection watchdog which he initially proposed as a new, internal module to Bitcoin Core. However, many of the required events and metrics can be collected by hooking into tracepoints. This means the watchdog could be an external runtime, which would speed up the watchdog development and requires less code and maintenance on the Bitcoin Core side.
If everything goes according to plan, the v23.0 release of Bitcoin Core, expected in early 2022, will include the first set of tracepoints. A goal is to enable USDT support in release builds by default, which still needs some work. Additionally, the tracepoint API should be semi-stable and thus needs testing.
In short: I have been adding tracepoints to Bitcoin Core that users can hook into to get insights into the internal state. The tracepoints are based on Linux kernel technology and do not require intrusive changes or custom tooling. The groundwork is done. Now further tracepoints can be added, and tooling can be written.
Coinbase is officially seeking applications for our 2021 developer grants focused on blockchain developers who contribute directly to a blockchain codebase, or researchers producing white papers. Learn more about the call for applications here.
Userspace, statically defined tracing support for Bitcoin Core was originally published in The Coinbase Blog on Medium, where people are continuing the conversation by highlighting and responding to this story.