Bitcoin is correcting losses and trading above $39,000 against the US Dollar. BTC could gain bullish momentum if it clears the $40,000 resistance zone.
Bitcoin is slowly recovering and trading above the $39,000 zone.
The price is trading above $39,200 and the 100 hourly simple moving average.
There was a break above a major bearish trend line with resistance near $38,980 on the hourly chart of the BTC/USD pair (data feed from Kraken).
The pair might accelerate higher and could even surpass the $40,000 resistance zone.
Bitcoin Price Starts Correction
Bitcoin price extended decline below the $38,000 support zone. However, BTC found support near the $37,150 zone and started a decent recovery wave.
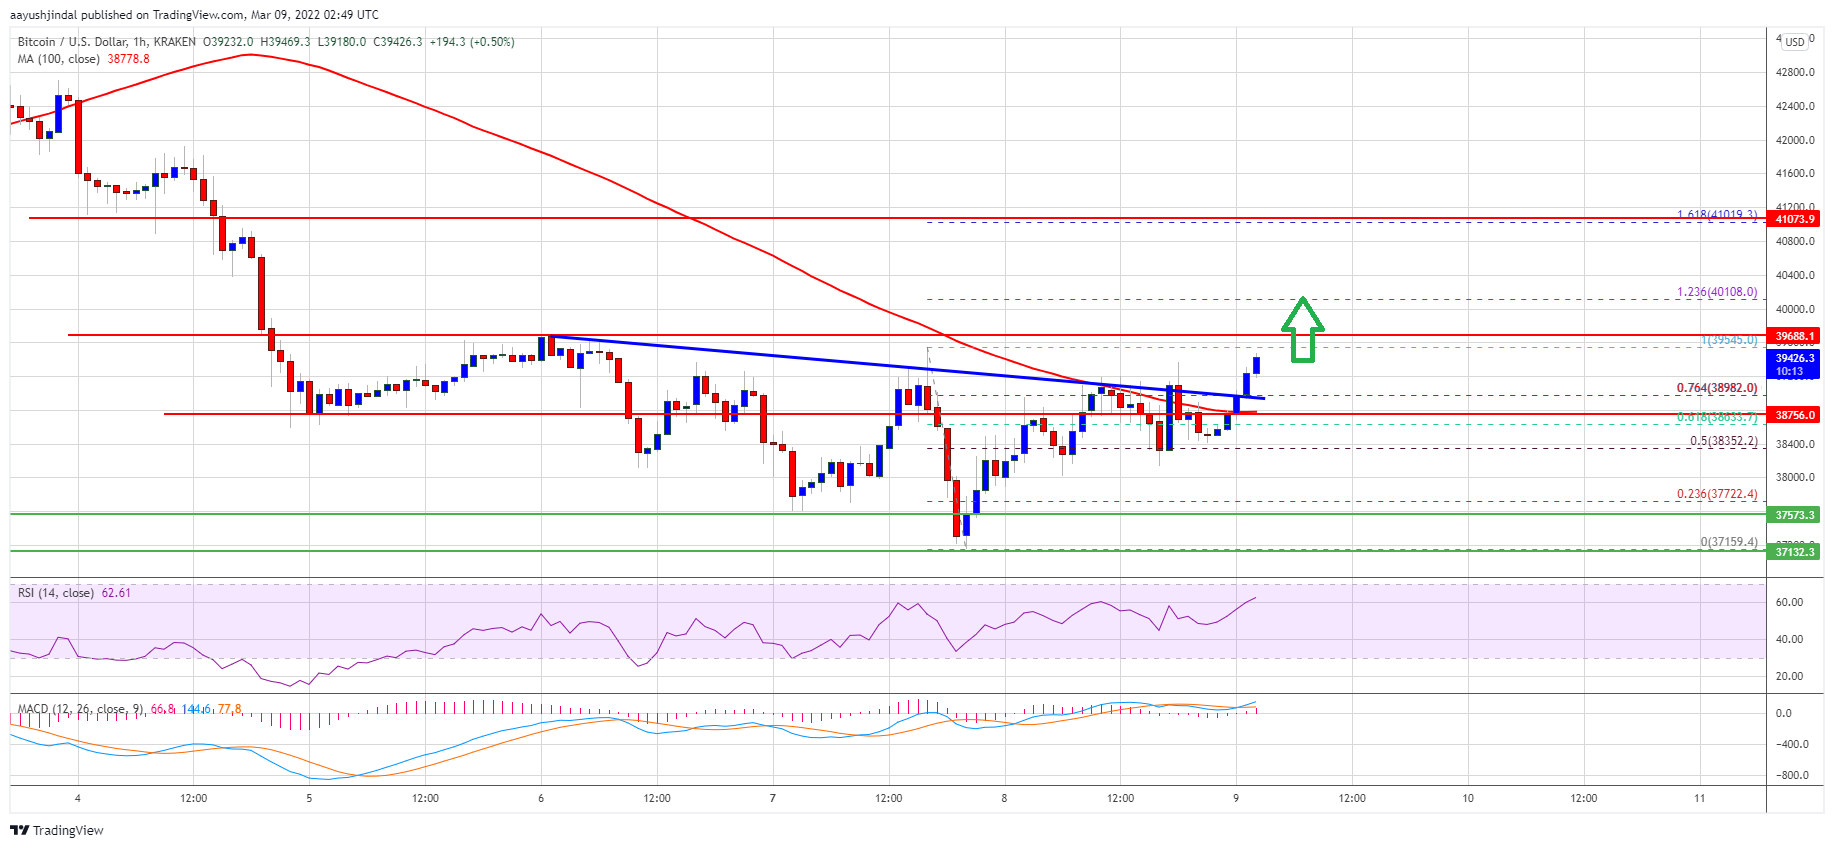
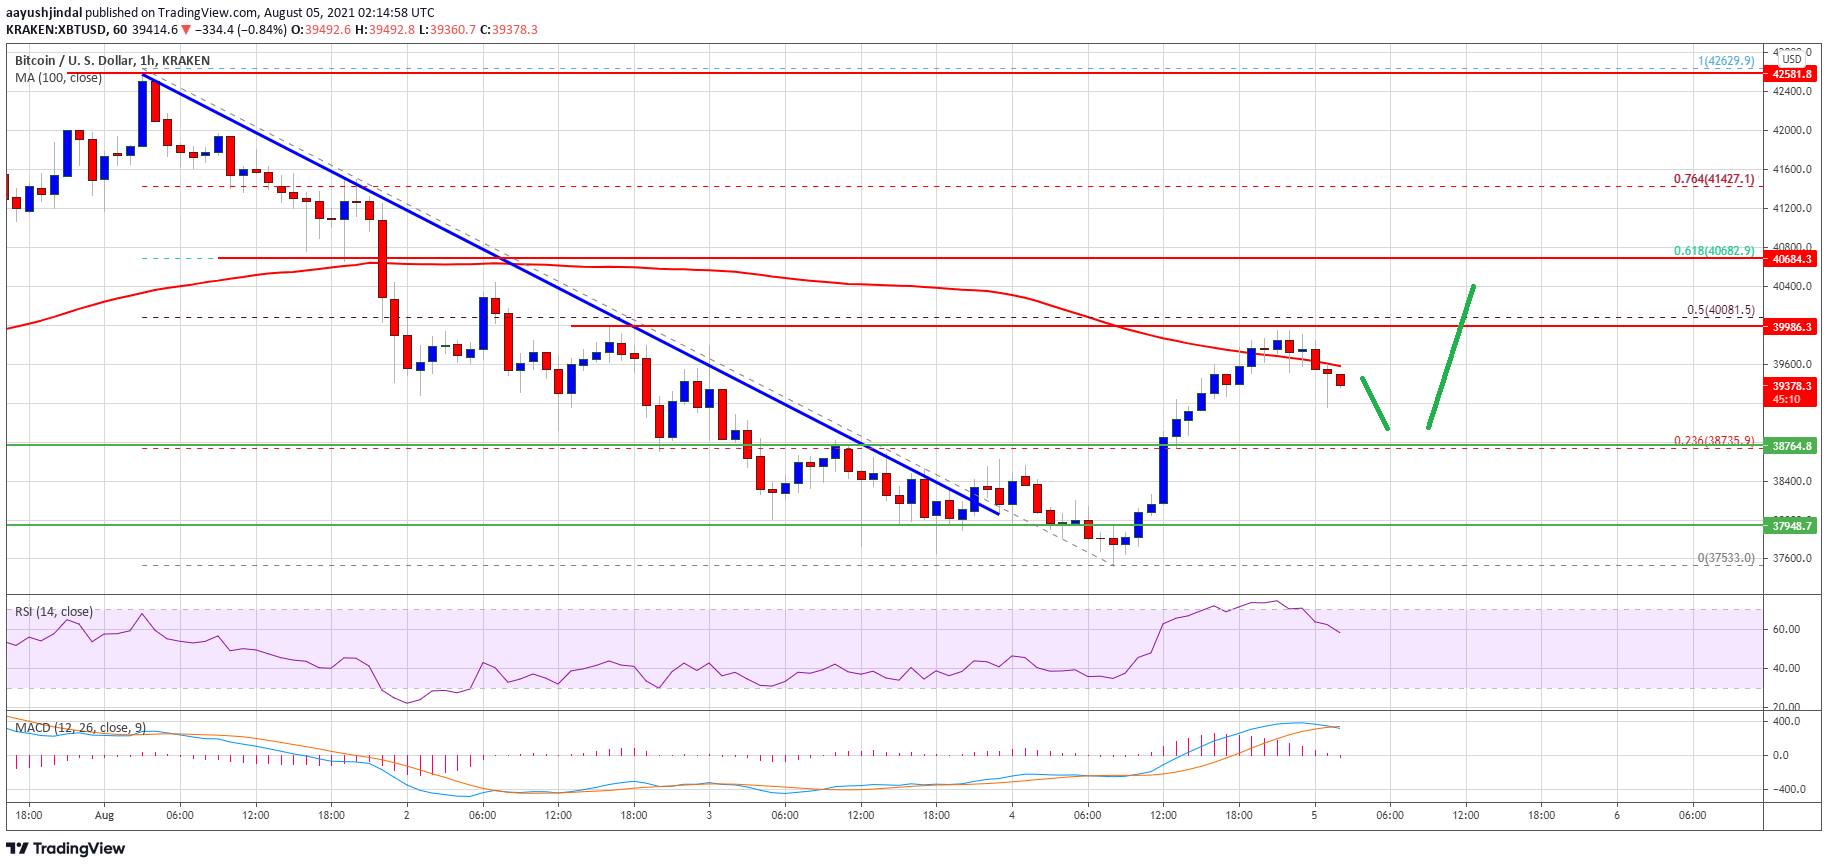
A low was formed near $37,159 before the price corrected higher. There was a move above the $38,000 and $38,500 resistance levels. The price was able to climb above the 76.4% Fib retracement level of the downward move from the $39,545 swing high to $37,159 low.
Besides, there was a break above a major bearish trend line with resistance near $38,980 on the hourly chart of the BTC/USD pair. Bitcoin is now trading above $39,200 and the 100 hourly simple moving average.
On the upside, an immediate resistance is near the $39,545 swing high. The next major resistance is near the $40,000 level. If there is a clear move above the $40,000 resistance zone, the price might accelerate higher. In the stated case, the price could rise towards the $41,000 zone.
Source: BTCUSD on TradingView.com
The 1.618 Fib extension level of the downward move from the $39,545 swing high to $37,159 low is also near the $41,000 level. Any more gains might send the price towards the $42,200 level.
Another Rejection in BTC?
If bitcoin fails to clear the $40,000 resistance zone, it could start another decline. An immediate support on the downside is near the $39,150 zone.
The next major support is seen near the $38,800 level and the 100 hourly simple moving average. If there is a downside break below the $38,800 support, the price might gain bearish momentum. In the stated case, there is a risk of a move towards the $37,500 level.
Technical indicators:
Hourly MACD – The MACD is now gaining pace in the bullish zone.
Hourly RSI (Relative Strength Index) – The RSI for BTC/USD is now above the 50 level.
Major Support Levels – $39,150, followed by $38,800.
Major Resistance Levels – $39,545, $40,000 and $41,000.
Bitcoin is struggling to recover above the $38,400 resistance zone against the US Dollar. BTC could resume decline if it stays below the $38,500 level.
Bitcoin is currently facing resistance near the $38,400 and $38,500 levels.
The price is trading below $38,500 and the 100 hourly simple moving average.
There is a crucial bearish trend line forming with resistance near $38,450 on the hourly chart of the BTC/USD pair (data feed from Kraken).
The pair could start a fresh decline if there is no clear move above $38,500.
Bitcoin Price Faces Hurdle
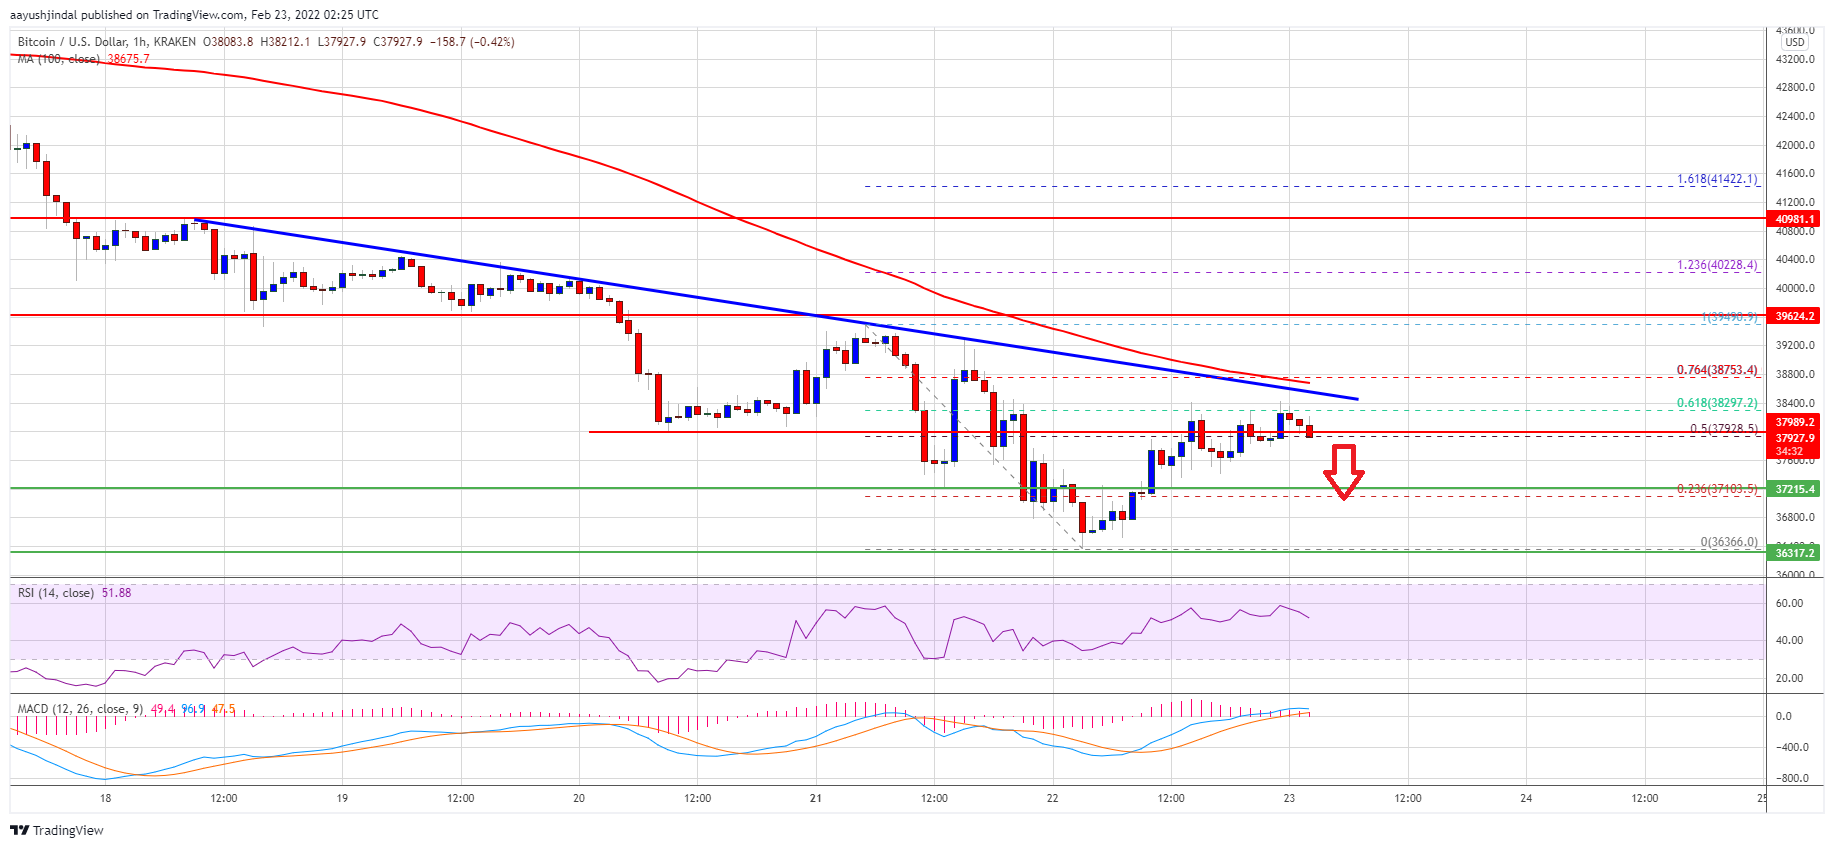
Bitcoin price found support near the $36,350 after a sharp decline. BTC formed a base and started a recovery wave above the $37,000 level. The price was able to surpass the $37,500 resistance level.
The bulls pushed the price above the 50% Fib retracement level of the key decline from the $39,492 swing high to $36,366 low. There was also a push above the $38,000 level. However, the price is now facing a strong resistance near the $38,250 level.
The 61.8% Fib retracement level of the key decline from the $39,492 swing high to $36,366 low is also near the $38,250 level. The next key resistance is near the $38,400 level.
There is also a crucial bearish trend line forming with resistance near $38,450 on the hourly chart of the BTC/USD pair. A clear move above the trend line resistance could send the price to $38,800 and the 100 hourly simple moving average.
Source: BTCUSD on TradingView.com
To gain bullish momentum, the price must settle above the $38,800 level. In the stated case, there are chances of a move above the $39,500 resistance.
Fresh Decline in BTC?
If bitcoin fails to start a recovery wave above the $38,400 resistance zone, it could start a fresh decline. An immediate support on the downside is near the $37,250 zone.
The next major support is seen near the $37,000 level. If there is a downside break below the $37,000 support zone, the price might gain bearish momentum for a move to $36,000. Any more losses could lead the price to $35,000.
Technical indicators:
Hourly MACD – The MACD is now losing pace in the bullish zone.
Hourly RSI (Relative Strength Index) – The RSI for BTC/USD is declining towards the 50 level.
Major Support Levels – $37,250, followed by $37,000.
Major Resistance Levels – $38,250, $38,400 and $39,500.
Bitcoin started a recovery wave above $36,000 against the US Dollar. BTC must settle above the $38,000 zone to start a steady upward move.
Bitcoin is trying to clear the $37,500 and $38,000 resistance levels.
The price is now trading above $36,500 and the 100 hourly simple moving average.
There is a key breakout pattern forming with resistance near $37,500 on the hourly chart of the BTC/USD pair (data feed from Kraken).
The pair could start a steady upward move if there is a clear move above the $38,000 resistance.
Bitcoin Price Eyes Upside Continuation
Bitcoin price managed to stay above the $35,000 zone and started a recovery wave. BTC climbed above the $36,000 resistance zone to move into a short-term bullish zone.
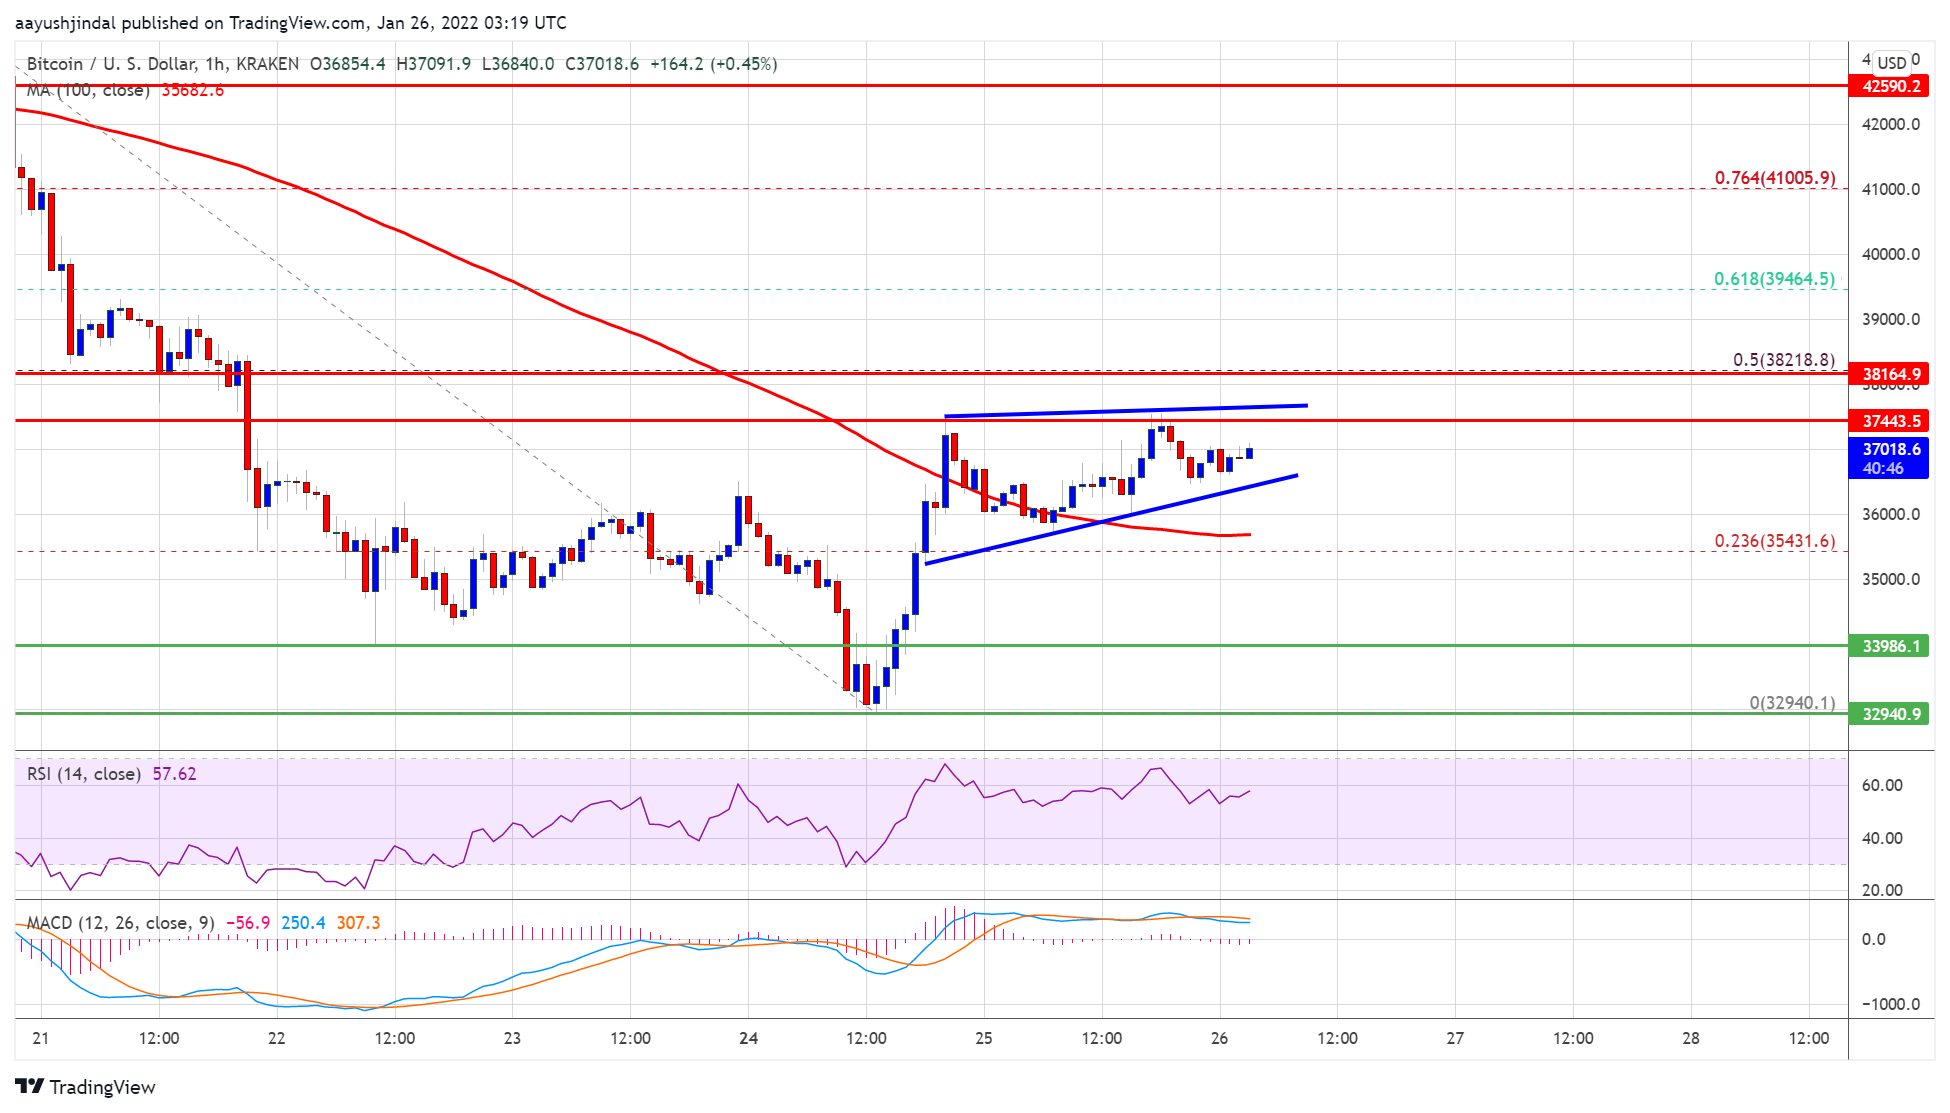
There was a break above the $36,500 and $36,800 resistance levels. Besides, there was a move above the 23.6% Fib retracement level of the key drop from the $43,495 swing high to $32,950 low. It is now consolidating near the $37,000 level and trading well above the 100 hourly simple moving average.
On the upside, an initial resistance is near the $37,400 level. There is also a key breakout pattern forming with resistance near $37,500 on the hourly chart of the BTC/USD pair.
Source: BTCUSD on TradingView.com
The first major resistance is near the $38,200 zone. It is near the 50% Fib retracement level of the key drop from the $43,495 swing high to $32,950 low. An upside break above the $38,200 resistance could start a steady upward move. The next key resistance is near the $49,200 level, above which the bulls might aim a test of $40,000. Any more gains might send bitcoin towards the $41,200 level.
Fresh Decline in BTC?
If bitcoin fails to start a fresh increase above $38,200, it could start another decline. An immediate support on the downside is near the $36,800 zone.
The first major support is seen near the $36,000 zone and the 100 hourly SMA. A downside break below the $36,000 support zone may perhaps start a fresh decline. The next major support is near $35,400, below which the price could revisit $34,000.
Technical indicators:
Hourly MACD – The MACD is now gaining pace in the bullish zone.
Hourly RSI (Relative Strength Index) – The RSI for BTC/USD is now above the 50 level.
Major Support Levels – $36,000, followed by $35,400.
Major Resistance Levels – $37,400, $38,000 and $38,200.
Bitcoin is still well below the $48,000 resistance against the US Dollar. BTC remains at a risk of a sharp decline if it fails to stay above the $45,500 support zone.
Bitcoin is trading in a bearish zone below the $48,000 resistance level.
The price is trading below $47,000 and the 100 hourly simple moving average.
There is a major bearish trend line forming with resistance near $47,000 on the hourly chart of the BTC/USD pair (data feed from Kraken).
The pair might start a strong recovery wave if it stays above the $45,500 support zone.
Bitcoin Price Eyes Recovery
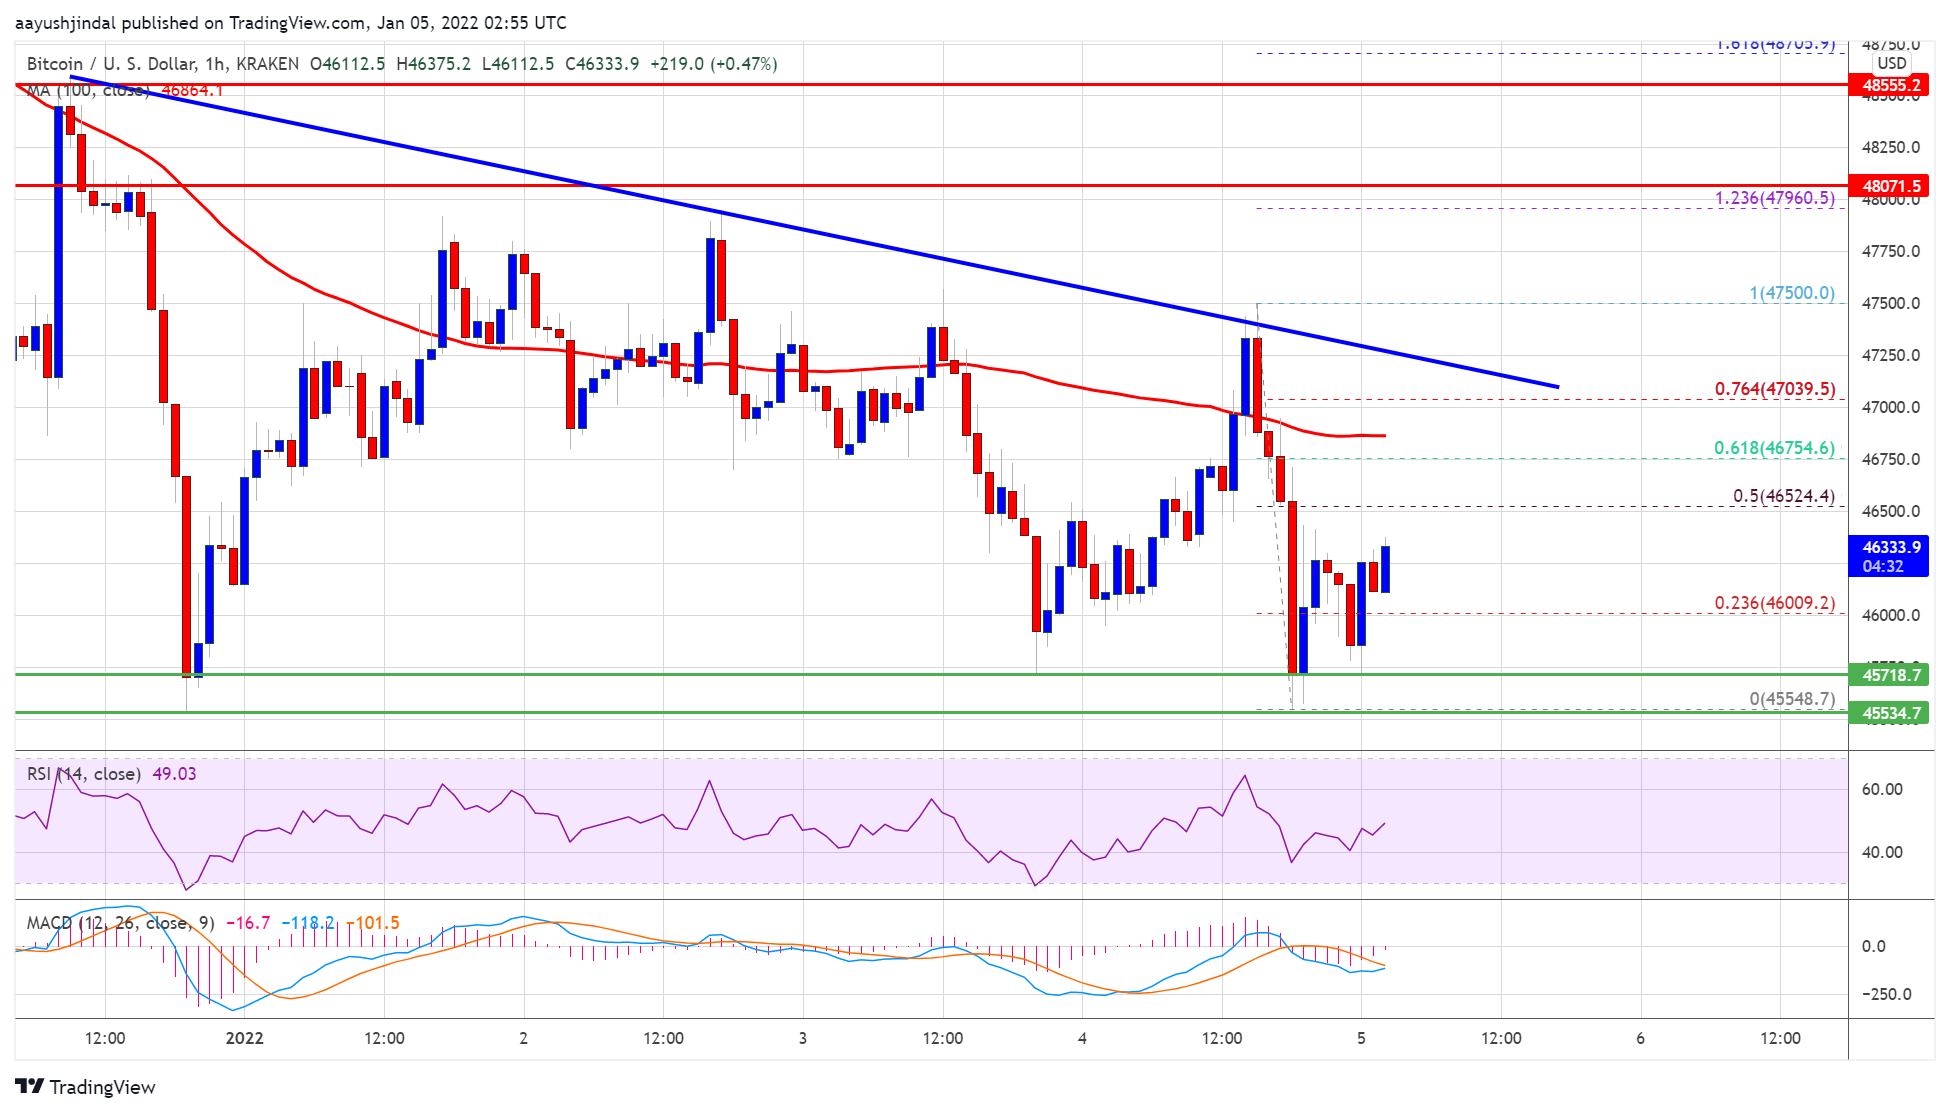
Bitcoin price attempted a fresh increase above the $47,000 level. However, BTC failed to clear the $47,500 level and started a fresh decline.
There was a clear move below the $47,200 and $47,000 levels. The price even dived below the $46,000 support zone. Finally, the bulls defended the main $45,500 support zone. A low is formed near $45,548 and the price is now consolidating losses.
Bitcoin is trading below $47,000 and the 100 hourly simple moving average. It recovered a few points above the 23.6% Fib retracement level of the recent drop from the $47,500 swing high to $45,548 low.
An initial resistance is near the $46,500 level. It is near the 50% Fib retracement level of the recent drop from the $47,500 swing high to $45,548 low. The first major resistance on the upside is near the $47,000 level. There is also a major bearish trend line forming with resistance near $47,000 on the hourly chart of the BTC/USD pair.
Source: BTCUSD on TradingView.com
A clear move above the $47,000 resistance zone and the trend line could start a strong recovery. The next major resistance is near the $48,000 level.
More Losses In BTC?
If bitcoin fails to recover above $46,500, it could continue to move down. An immediate support is near the $46,000 zone. The first major support is near $45,500.
A downside break below the $45,500 level could push the price further lower. In the stated case, the price may possibly decline towards the $43,000 level in the coming sessions.
Technical indicators:
Hourly MACD – The MACD is now losing pace in the bearish zone.
Hourly RSI (Relative Strength Index) – The RSI for BTC/USD is near the 50 level.
Major Support Levels – $46,000, followed by $45,500.
Major Resistance Levels – $46,500, $47,000 and $47,500.
Cryptocurrency data aggregator CoinGecko has released its Q3 2021 report showing massive gains across several crypto market sectors.
Following the May market crash, Q3 began on a low ebb for the crypto space, with market capitalization even dipping further in late July below the $1.2 trillion, less than half of the $2.5 trillion all-time high recorded only two months prior.
However, market capitalization did recover in Q3, even rising as high as $2.3 trillion in early September.
According to the CoinGecko report, Bitcoin (BTC), gaming “coins,” and nonfungible tokens (NFTs) dominated the crypto market space in Q3.
Bitcoin recorded a 25% increase between Q2 and Q3 and has continued on this upward trajectory, even reaching $60,000 for the first time in five months.
The network’s hash rate also experienced a resurgence in Q3, indicating a recovery from China’s sweeping crackdown that forced miners to relocate overseas.
Gaming tokens like Axie Infinity (AXS), Illuvium (ILV), and Gala (GALA), as well as the NFT space in general, did record massive gains in Q3 as well.
AXS, in particular returned almost 1,000% quarter-on-quarter gains, with its 2021 performance topping 13,700%.
In terms of NFT trading volume, OpenSea continued its dominance of the market segment. Indeed, OpenSea and Rarible recorded a total trading volume of about $6.8 billion in Q3 according to the CoinGecko report.
Related: Crypto markets soar after Fed commits to printing and Evergrande plans to pay its debt
These significant market gains also came on the back of a storm of regulatory concerns regarding cryptocurrencies. Policymakers in the United States seemingly applied pressure with calls for stricter laws surrounding market segments like stablecoins.
Despite the steady gains recorded in Q3, the crypto market recovery is still some way off the activity levels seen before the May crash.
For one, CoinGecko reported that spot trading volume across the major centralized and decentralized exchanges declined over 42% in Q3.
Bitcoin price started a fresh increase from the $37,500 support against the US Dollar. BTC must clear the 100 hourly SMA and $40,000 to move into a positive zone.
Bitcoin started a decent increase above the $38,000 and $38,500 resistance levels.
The price is now struggling near the $40,000 zone and the 100 hourly simple moving average.
There was a break above a major bearish trend line with resistance near $38,250 on the hourly chart of the BTC/USD pair (data feed from Kraken).
The pair must settle above the $40,000 barrier to continue higher in the near term.
Bitcoin Price is Rising
Bitcoin price extended its decline below the $38,200 and $38,000 support levels. BTC tested the $37,500 zone, where the bulls took a stand.
A base was formed near $37,500 before the price started a fresh increase. Earlier, there was a break above a major bearish trend line with resistance near $38,250 on the hourly chart of the BTC/USD pair. The pair climbed higher nicely above the $38,000 and $38,500 resistance levels.
Bitcoin broke the 23.6% Fib retracement level of the main decline from the $42,630 swing high to $37,533 low. It is now struggling near the $40,000 zone and the 100 hourly simple moving average.
Source: BTCUSD on TradingView.com
The 50% Fib retracement level of the main decline from the $42,630 swing high to $37,533 low is also near the $40,000 zone. Therefore, a close above the 100 hourly SMA and $40,000 might trigger a steady increase. The next major resistance is near the $41,500 level. Any more gains could set the pace for a move towards the $42,500 resistance zone in the near term.
Fresh Decline in BTC?
If bitcoin fails to climb above the $40,000 and $40,200 resistance levels, it could start a fresh downside correction. An initial support on the downside is near the $39,000 level.
The first major support is now near the $38,750 zone. A clear downside break below the $38,750 support might call for a sharp decline. In the stated case, the price might decline towards the $38,000 level. The next major support is near the $37,500 zone.
Technical indicators:
Hourly MACD – The MACD is slowly losing pace in the bullish zone.
Hourly RSI (Relative Strength Index) – The RSI for BTC/USD is now well above the 50 level.
Major Support Levels – $38,750, followed by $38,000.
Major Resistance Levels – $40,000, $40,200 and $41,200.
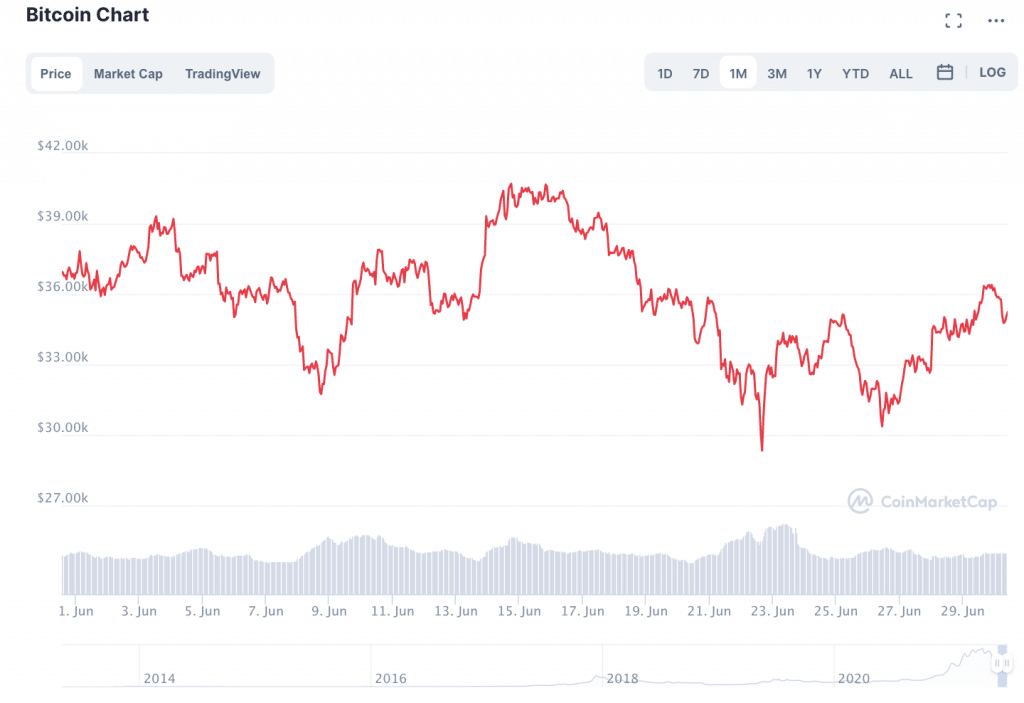
As the month of June draws to a close, Bitcoin is continuing to trade within the $30K – $40K range for the fourth week in a row.
Justin Hartzman, Chief Executive of Canadian cryptocurrency trading platform, CoinSmart.
Bank Account Alternative. Business Account IBAN.
Justin Hartzman, Chief Executive of Canadian cryptocurrency trading platform, CoinSmart, told Finance Magnates that: “It’s no secret that the crypto market has more or less been moving along sluggishly.”
Indeed, BTC still does not seem to have enough momentum to make strong moves one way or the other. While BTC briefly dropped below $30K earlier this month, a move that many feared would lead to further drops, it quickly recovered to levels just over $30K.
“During this recent surge, the Bitcoin price managed to flip the 20-day simple moving average from resistance to support,” Hartzman explained. “This is crucial as the bulls have gained a strong support wall which could prevent a further fall.”
On the other hand, BTC does not seem to have enough support to break through the other side of the $30K – $30K range, either. “The Bitcoin price faces a major resistance wall between $36,500 – $38,500.”
Was Bitcoin Oversold in May?
According to IntoTheBlock’s IOMAP metric, “around 1.65 million addresses had purchased ~850,000 BTC tokens at this level,” Hartzman explained. IOMAP, which stands for “Out of the Money Around Current Price,” identifies the ten most relevant clusters of investor positions at a range of +-15% of Bitcoin’s price at any given moment.
Doug Schwenk, Chairman and Chief Executive of Digital Assets Research (DAR).
“It’s likely true that BTC’s price was overly-impacted by some negative news events in the past weeks.”
“If the buyers somehow flip this wall from resistance to support, $40,000 is definitely within reach,” he continued. “It depends on the appetite for long-term investors in further accumulation of BTC during this market phase.”
Doug Schwenk, Chairman of Digital Asset Research (DAR), added that Bitcoin’s price movement has “been very positive over the past couple of days, and could continue upward.”
“BTC trades largely on sentiment, and if that continues to be positive in the coming hours and days, we could easily see BTC trade above $40k. It’s likely true that BTC’s price was overly-impacted by some negative news events in the past weeks which has seen it trade lower than anticipated.” Indeed, the government of China has been cracking down on cryptocurrency mining, leading to some uncertainty in Bitcoin markets. However, some analysts believe that this crackdown will not hinder BTC’s growth in the long term.
Banning Bitcoin mining makes the network more resilient.
Future generations will look at this time and it’ll be obvious that a decentralised monetary network at scale is more resilient than a nation state acting against it. https://t.co/8pTe4snjpZ
Exchanging Gift Cards to Crypto, Bitcoin’s Adoption Going MainstreamGo to article >>
Of course, “It’s always at risk of falling further, especially as an asset that trades on sentiment and doesn’t yet have a strong economic use case.” However, BTC’s recent sell-off “has been perceived as over done, which likely brings buyers back into the market. Only time will tell if that view will turn into action.”
Leverage Has Been Purged from Bitcoin, Possibly Promoting Healthier BTC Growth
This prolonged period of relative stagnancy in the price of Bitcoin seems to reflect the possibility that much of the leverage that propped the Bitcoin price up earlier this year has been purged from the market.
Indeed, the elimination of leverage from Bitcoin was cited as the reason for BTC’s price crash in May. Over the course of the month, the price of BTC dropped from $58,000 to $34,000; at its lowest point, the price of Bitcoin was nearly $32K.
Tom Howard, Head of Business Development & Growth at PowerTrade, told Finance Magnates that: “Funding rates appear to have stabilized near zero or slightly negative, which indicates the overexposed bulls have rinsed out and bears are being cautious.”
“Realized volatility has fallen, indicating that over-leveraged positions have been closed out, and that market strength is building.”
Tom Howard, Head of Business Development & Growth at PowerTrade.
Indeed, while leverage seems to have been the driving force that drove the price of Bitcoin to unprecedented heights earlier this year, the market structure was practically wiped away in an instant. A Bitcoin that is overly pumped by leverage has a house built on the sand. Now that leverage has been expelled, BTC may have a shot at building its house on the rock.
In the Short-Term, “De-Levered Markets Get Crushed”
American entrepreneur-turned-crypto enthusiast, Mark Cuban Tweeted about the effects of leveraged trading in the midst of the price drop: “De-Levered Markets get crushed,” he said.
“Doesn’t matter what the asset is. Stocks. Crypto. Debt. Houses. They bring forced liquidations and lower prices. But, crypto has the same problem that HFTs (high-frequency traders) bring to stocks, front-running is legal, as gas fees introduce latency that can be gamed That makes drops drop faster, and gains go up faster,” he said.
While the price drop seemed to foster negative opinions about Bitcoin related to short term price volatility, some analysts believe that the expulsion of leverage from the market is a positive thing for BTC over the long term. Hartzman said that: “this is a good thing, as some semblance of normalcy can now return to the market.”
“There was way too much leverage for market dynamics to remain sustainable over the long-term.”
“Altcoins Are Seeing a Surge That’s Not Necessarily Reflected in Bitcoin Dynamics.”
While Bitcoin may be moving sluggishly, altcoins are seeing much stronger price movements. “Bitcoin is the market leader so it definitely has a major impact on the price movement of altcoins,” Hartzman told Finance Magnates.
“Even so, altcoins are seeing a surge that’s not necessarily reflected in the bitcoin dynamics. There’s been renewed interest in DeFi and many investors are taking the low volatility in BTC prices to revisit the fundamentals of other promising crypto projects.”
Additionally, Schwenk told Finance Magnates that: “We see continued interest in a rotation from BTC into so-called altcoins.”
“Some buyers have been quicker to act on that interest and some are waiting. There is a strong narrative to altcoins as an alternative on several metrics including, ESG and fundamentals. We think, based on client feedback, that this trend will continue over the next year as Ethereum transitions to proof-of-stake and changes happen in the altcoin ecosystem.”
What are your thoughts on Bitcoin’s price movements and their effects on the altcoin market? Let us know in the comments below.