Tag: price

  • Analyst Projects 400% Price Increase

    Analyst Projects 400% Price Increase

    [ad_1]

    VeChain (VET), a blockchain platform aiming to revolutionize supply chain management, has become a hot topic in the cryptocurrency world. A recent surge in VET’s price, coupled with technical breakthroughs, has ignited a wave of optimism among investors and analysts.

    VeChain Shatters Resistance Levels, Bullish Flag Signals New Highs

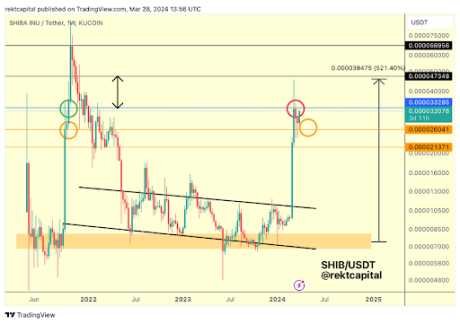
    The good news for VeChain started with a decisive break above a multi-year downtrend line. This technical indicator, closely watched by analysts, suggests a potential shift in long-term market sentiment. Additionally, VET decisively surpassed a key horizontal resistance level, adding fuel to the bullish fire.

    At the time of writing, VET was trading at $0.04, down 3.1% in the last 24 hour, but managed to sustain a 17% gain the last week, data from Coingecko shows.

    Following this breakout, VeChain entered a consolidation phase, a period of sideways trading often seen after a significant price increase. However, this pause proved to be temporary. VET recently emerged from a bullish flag formation, a technical pattern known for preceding substantial price increases. Analysts are interpreting this breakout as a sign that VeChain is poised for another leg up.

    400% Surge Anticipated: Will VeChain Live Up To The Hype?

    Capitalizing on the bullish sentiment, crypto analysts have made some bold predictions. World of Charts, a prominent analyst group, is forecasting a staggering 400% increase in VET’s value in the coming weeks.

    X user Clifton Fx also provided a positive outlook. A 25% surge to $0.06 is in the cards in the next days, the expert said, pointing to VET’s “bullish flag” on the daily period.

    However, the cryptocurrency market is notorious for its volatility, and unforeseen events can trigger rapid price swings. While the technical indicators and analyst forecasts paint a rosy picture for VeChain, there’s no guarantee that the predicted surge will materialize.

    VET market cap currently at $3.5 billion. Chart: TradingView.com

    Beyond The Hype: VeChain’s Real-World Potential

    VeChain’s appeal goes beyond the recent technical triumphs and the allure of potential windfalls. Unlike many cryptocurrencies focused solely on speculation, VeChain offers a tangible solution to real-world problems. Its blockchain platform tackles inefficiencies and lack of transparency in supply chains, a multi-trillion dollar industry ripe for disruption.

    VET weekly price action. Source: Coingecko

    VeChain’s technology allows businesses to track products throughout the entire supply chain process, ensuring authenticity, quality, and efficient logistics. This not only benefits businesses but also empowers consumers with greater transparency about the products they purchase.

    VeChain’s recent surge and optimistic forecasts present an attractive opportunity for investors. However, the inherent volatility of the cryptocurrency market cannot be overstated.

    Featured image from Binance Academy, chart from TradingView

    Disclaimer: The article is provided for educational purposes only. It does not represent the opinions of NewsBTC on whether to buy, sell or hold any investments and naturally investing carries risks. You are advised to conduct your own research before making any investment decisions. Use information provided on this website entirely at your own risk.


    [ad_2]

    Source link

  • Will This “Dry Powder” and Historical Trends Fuel A Price Boom?

    Will This “Dry Powder” and Historical Trends Fuel A Price Boom?

    [ad_1]

    While Bitcoin has dipped from its recent highs of around $74,000, some analysts are urging investors to stay calm and even see this as a buying opportunity. So far, Bitcoin prices have remained under pressure, trickling lower in the past trading week.

    Are There Similarities With The Bitcoin Bull Run Of 2020?

    Though the downward momentum is slowing down, and there has been no confirmation of the April 2 dump, the failure of bulls to convincingly flow back and drive the coin above $71,000 remains a concern for some traders. 

    Bitcoin price trending sideways on the daily chart | Source: BTCUSDT on Binance, TradingView
    Bitcoin price trending sideways on the daily chart | Source: BTCUSDT on Binance, TradingView

    Even so, taking a bullish stand, one analyst on X compares the current formation with that of 2020. Pointing to the cyclic nature of prices and the inevitability of retracements from bottoms and peaks, the trader expects prices to bounce.

    The trader said that in 2020, when Bitcoin prices fell, shaking out weak hands, the recovery sparked a bull run that forcefully saw the coin surge above previous all-time highs of $20,000. The analyst seems to allude to the retracement before the breakout as a catapult that eventually fed the “legendary” bull run, which saw Bitcoin float to as high as $70,000.

    BTC historical performance | Source: Analyst on X
    BTC historical performance | Source: Analyst on X

    Based on this comparison, the trader is adamant that it may, reading from history, be the best time to “sell” at around spot levels. Still, for now, buyers can consider doubling down until there is a clear trend definition and shake-off of the current bear formation. Currently, BTC has strong rejections in the $71,700 to $72,000 liquidation zone, marking last week’s highs.

    Watch Out For The “Dry Powder”

    Besides technical candlestick formation, another trader thinks buyers better HODL even with sellers in control.

    In a post on X, the analyst said Tether Holdings, the issuer of USDT, and Circle, the issuer of USDC, recently minted billions. On April 2, Tether issued 1 billion USDT on Tron, while Circle issued 250 million USDC on Solana. 

    This development, the analyst said, means there is “plenty of dry powder.” Stablecoins like USDT and USDC offer stability in the crypto markets, providing a refuge for crypto holders whenever prices tumble. 

    Tether minting USDT on Tron | Source: Analyst on X
    Tether minting USDT on Tron | Source: Analyst on X

    However, they can also act as conduits of liquidity from the traditional market, providing an avenue for interested users to get exposure to top coins or even engage in activities such as decentralized finance (DeFi). 

    In the past, prices often edged higher when there were huge stablecoin mints.

    Feature image from Canva, chart from TradingView

    Disclaimer: The article is provided for educational purposes only. It does not represent the opinions of NewsBTC on whether to buy, sell or hold any investments and naturally investing carries risks. You are advised to conduct your own research before making any investment decisions. Use information provided on this website entirely at your own risk.


    [ad_2]

    Source link

  • Crypto Expert Predicts Massive Shiba Inu Run As Price Mirrors 2021

    Crypto Expert Predicts Massive Shiba Inu Run As Price Mirrors 2021

    [ad_1]

    Crypto expert Rekt Capital has suggested that Shiba Inu (SHIB) could follow a similar trajectory to its move back in 2021. If so, this sets up the crypto token for a parabolic move that could see it hit its all-time high (ATH) and even surpass it. 

    2024 Shiba Inu To Mirror 2021 Action

    Rekt Capital mentioned in an X (formerly Twitter) post that SHIB’s retest was successful and that history was repeating itself. According to him, SHIB needs to break above the $0.000033285 price range to begin its uptrend continuation. In a previous post, the crypto analyst raised the possibility of SHIB’s price action mirroring the one from 2021. 

    He noted how SHIB came close to that price range but couldn’t break this resistance level. This was the same thing in late 2021, as Shiba Inu didn’t break that resistance level on the first attempt. That forced the meme coin to retest the $0.000026041 price level as a new support before confirming further upside. 

    Shiba Inu

    Source: X

    This time, Shiba Inu also retested that $0.000026041 price level during its recent price dip, which was partly caused by a wave of profit-taking. The meme coin showed great resolve and somehow managed to hold above that level, and it has since made a good recovery. 

    Now, it needs to break above the $0.000033285 price range to confirm that history is repeating itself and that a price surge to the one in 2021 is on the horizon. 2021 was SHIB’s breakout year when it enjoyed a mouth-watering gain of 46,000,000% on its way to an ATH of $0.00008845 in October 2021. 

    Analysts Optimistic About Shiba Inu’s Future Trajectory

    Rekt Capital isn’t the only one optimistic about SHIB’s future trajectory. Crypto analyst and trader Xanrox recently predicted that SHIB could rise to $0.00008854 by July, representing a new ATH for the meme coin. Interestingly, that looks to be only the starting point for the meme coin, as other analysts have predicted that SHIB could shed another zero. 

    One of them is crypto investor and analyst Oscar Ramos, who expressed his bullish sentiment about the meme coin when he predicted it could rise to $0.0001. Technical analyst Javon Marks also echoed similar sentiments when he suggested that SHIB could rise to as high as $0.0001553. 

    Meanwhile, crypto analyst Ali Martinez once suggested that SHIB’s price gain in 2021 could be nothing compared to what lies ahead for the meme coin. Specifically, Martinez predicted that Shiba Inu could see a historic 122,000% price surge to $0.011.

    At the time of writing, SHIB is trading around $0.00003116, up over 3% in the last 24 hours according to data from CoinMarketCap. 

    Shiba Inu price chart from Tradingview.com

    SHIB price at $0.00003 | Source: SHIBUSDT on Tradingview.com

    Featured image from Coinpedia, chart from Tradingview.com

    Disclaimer: The article is provided for educational purposes only. It does not represent the opinions of NewsBTC on whether to buy, sell or hold any investments and naturally investing carries risks. You are advised to conduct your own research before making any investment decisions. Use information provided on this website entirely at your own risk.

    [ad_2]

    Source link

  • Ethereum Price Could Regain Strength If It Clears This Key Hurdle

    Ethereum Price Could Regain Strength If It Clears This Key Hurdle

    [ad_1]

    Ethereum price is attempting a fresh increase wave above the $3,400 zone. ETH must clear the $3,580 resistance to continue higher in the near term.

    • Ethereum is holding gains above the $3,250 support zone.
    • The price is trading above $3,400 and the 100-hourly Simple Moving Average.
    • There was a break above a key bearish trend line with resistance at $3,400 on the hourly chart of ETH/USD (data feed via Kraken).
    • The pair could continue to rise if it settles above the $3,500 resistance zone.

    Ethereum Price Eyes Fresh Increase

    Ethereum price remained stable above the $3,250 support zone. ETH formed a base and started a fresh increase above the $3,350 resistance level, like Bitcoin.

    ETH climbed above the $3,400 resistance zone. There was a move above the 50% Fib retracement level of the downward move from the $3,587 swing high to the $3,250 low. There was a break above a key bearish trend line with resistance at $3,400 on the hourly chart of ETH/USD.

    Ethereum is now trading above $3,400 and the 100-hourly Simple Moving Average. On the upside, immediate resistance is near the $3,500 level. It is near the 76.4% Fib retracement level of the downward move from the $3,587 swing high to the $3,250 low.

    Ethereum Price

    Source: ETHUSD on TradingView.com

    The first major resistance is near the $3,550 level. The next key resistance sits at $3,580, above which the price might gain bullish momentum. In the stated case, Ether could rally toward the $3,720 level. If there is a move above the $3,720 resistance, Ethereum could even climb toward the $3,880 resistance. Any more gains might call for a test of $4,000.

    Another Decline In ETH?

    If Ethereum fails to clear the $3,500 resistance, it could start another decline. Initial support on the downside is near the $3,400 level.

    The first major support is near the $3,250 zone. The next key support could be the $3,060 zone. A clear move below the $3,060 support might send the price toward $3,000. Any more losses might send the price toward the $2,880 level.

    Technical Indicators

    Hourly MACDThe MACD for ETH/USD is gaining momentum in the bullish zone.

    Hourly RSIThe RSI for ETH/USD is now above the 50 level.

    Major Support Level – $3,400

    Major Resistance Level – $3,580

    Disclaimer: The article is provided for educational purposes only. It does not represent the opinions of NewsBTC on whether to buy, sell or hold any investments and naturally investing carries risks. You are advised to conduct your own research before making any investment decisions. Use information provided on this website entirely at your own risk.

    [ad_2]

    Source link

  • BONK Bonked: Price Crashes 30% In 7 Days

    BONK Bonked: Price Crashes 30% In 7 Days

    [ad_1]

    The memecoin BONK has faced a significant setback as its prices plummeted by 30% in the last week, sparking discussions about the need to reassess predictions for this meme token. This decline in value has been accompanied by a drop in BONK’s open interest to its lowest level in the past month, signaling potential challenges ahead for the token.

    Market Performance And Price Predictions

    The recent slump in BONK’s prices has raised concerns among investors and traders, with key technical indicators hinting at the possibility of further declines in its value. At present, BONK is trading at $0.000023, making it one of the cryptocurrencies with the most losses over the past week. The altcoin’s future trajectory remains uncertain as market dynamics continue to evolve.

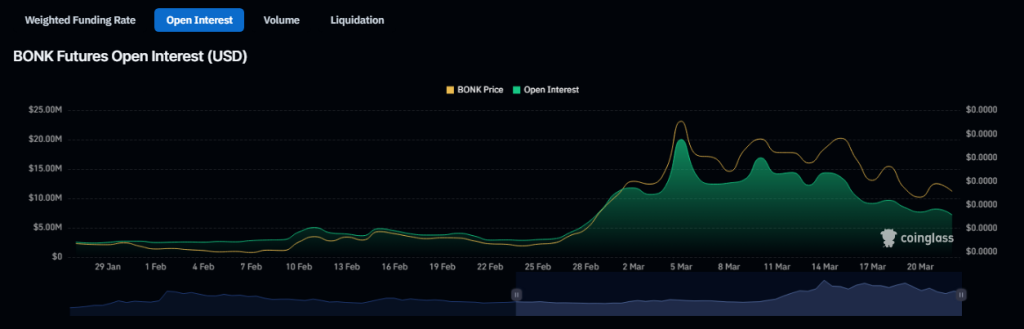
    BONK price down in the last seven days. Source: Coingecko

    Following a rejection at $0.00004, the price of BONK lost momentum and had a 35% value adjustment. After then, there was a period of sideways trading for the memecoin. The bulls lost steam as the volatility increased and broke through the support level; the market has been trading sideways ever since.

    The recent analysis of BONK’s price performance reveals a shift in sentiment towards bearish outlooks, with weighted sentiment turning negative and key technical indicators confirming the presence of bearish sentiments. This negative sentiment among market participants could potentially lead to further declines in BONK’s value unless there is a significant shift in market dynamics.

    Source: Coinglass

    Open Interest Plummets

    Futures open interest in the cryptocurrency fell to its lowest level in one month, which led to a decrease in its price. The open interest in BONK began to fall on March 5th and has since fallen by 60%, according to statistics from Coinglass.

    Traders’ interest or involvement in the derivative market for an asset declines as its open interest diminishes. This usually happens when there is a change in investor mood, leading to more people trying to cut losses or take profits.

    Total crypto market cap at $2.4 trillion on the daily chart: TradingView.com

    Impact On Investor Sentiment And Market Dynamics

    The recent price slump in BONK has had a notable impact on investor sentiment, with many adopting a cautious approach towards the token’s future prospects. This shift in sentiment has also influenced trading volumes and market activity, as investors reassess their positions and strategies in light of BONK’s price movements.

    Expert Price Predictions And Analysis

    As market observers examine BONK’s price predictions, varying outlooks emerge regarding its future performance. While some forecasts suggest a bearish scenario with a price of $0.000018 in 2024, others paint a more optimistic picture, projecting an average price of $0.000067 by April 17, 2024. These contrasting predictions highlight the volatility and unpredictability inherent in the cryptocurrency market.

    Featured image from Andrea Piacquadio/Pexels, chart from TradingView

    Disclaimer: The article is provided for educational purposes only. It does not represent the opinions of NewsBTC on whether to buy, sell or hold any investments and naturally investing carries risks. You are advised to conduct your own research before making any investment decisions. Use information provided on this website entirely at your own risk.

    [ad_2]

    Source link

  • Neutrino Dollar breaks peg, falls to $0.82 amid WAVES price ‘manipulation’ accusations

    Neutrino Dollar breaks peg, falls to $0.82 amid WAVES price ‘manipulation’ accusations

    [ad_1]

    Neutrino Dollar (USDN), a stablecoin issued through Waves-backed Neutrino protocol, lost its U.S. dollar-peg on April 4 amid speculations that it could become “insolvent” in the future.

    USDN plunges 15% despite WAVES backing

    USDN dropped to as low as $0.822 on April 4 with its market capitalization also diving to $824.25 million, down 14% from its year-to-date high of $960.25 million.

    Interestingly, the stablecoin’s plunge occurred despite Neutrino’s claims of backing its $1-peg via what’s called “over collateral,” i.e., when the total value of Waves (WAVES) tokens locked inside its smart contract is higher than the total USDN minted, also called the “backing ratio.”

    Neutrino Dollar price performance in the last 24 hours. Source: CoinMarketCap

    Notably, Neutrino smart contract’s backing ratio came out to be 2.62 on April 4, according to official data, underscoring that it had adequate funds to back USDN’s dollar-peg by 1:1; that is, despite WAVES’ 35%-plus drop in the last five days.

    Price manipulation

    WAVES’ price dropped from its record high near $64 on March 31 to as low as $47 on April 4. The coin started declining as its momentum indicator, the relative strength index (RSI), jumped above 70 — an “overbought” area that typically triggers selling sentiment.

    WAVES/USD daily price chart. Source: TradingView

    Nonetheless, the selloff occurred also as a pseudonymous analyst accused Waves of artificially pumping WAVES by 750% in the last two months by:

    1) collateralizing USDN to borrow USD Coin (USDC) on the Vires.Finance lending platform;

    2) using the proceeds to purchase WAVES;

    3) converting the tokens to USDN, and 

    4) redeploying them into the Vires.Finance pool to borrow more USDC.

    The analyst also said that a decisive WAVES’ price crash would make USDN insolvent.

    Waves founder Sasha Ivanov, however, denied the allegations on April 3, noting that one cannot move markets of more than $1 billion daily volume by borrowing a few million.

    He further accused Alameda Research, a quantitative crypto trading firm headed by FTX’s Sam Bankman-Fried, of launching a campaign “fueled by a crowd of paid trolls” against WAVES to honor their short positions on the coin.

    Related: Here’s how traders were alerted to RUNE’s, FUN’s, WAVES’ and KNC’s big rallies last week

    From a technical perspective, WAVES holds its bullish bias above the confluence of two support levels: the 20-day exponential moving average (20-day EMA; the green wave) around $40 and the 0.382 Fib line near $42.50.

    Conversely, a decisive break below the support confluence could risk crashing WAVES toward $30.

    The views and opinions expressed here are solely those of the author and do not necessarily reflect the views of Cointelegraph.com. Every investment and trading move involves risk, you should conduct your own research when making a decision.