Ethereum fell to $2,930 before correcting higher against the US Dollar. ETH price is rising and a close above $3,200 could spark a strong recovery.
Ethereum extended decline and broke the $3,000 support zone.
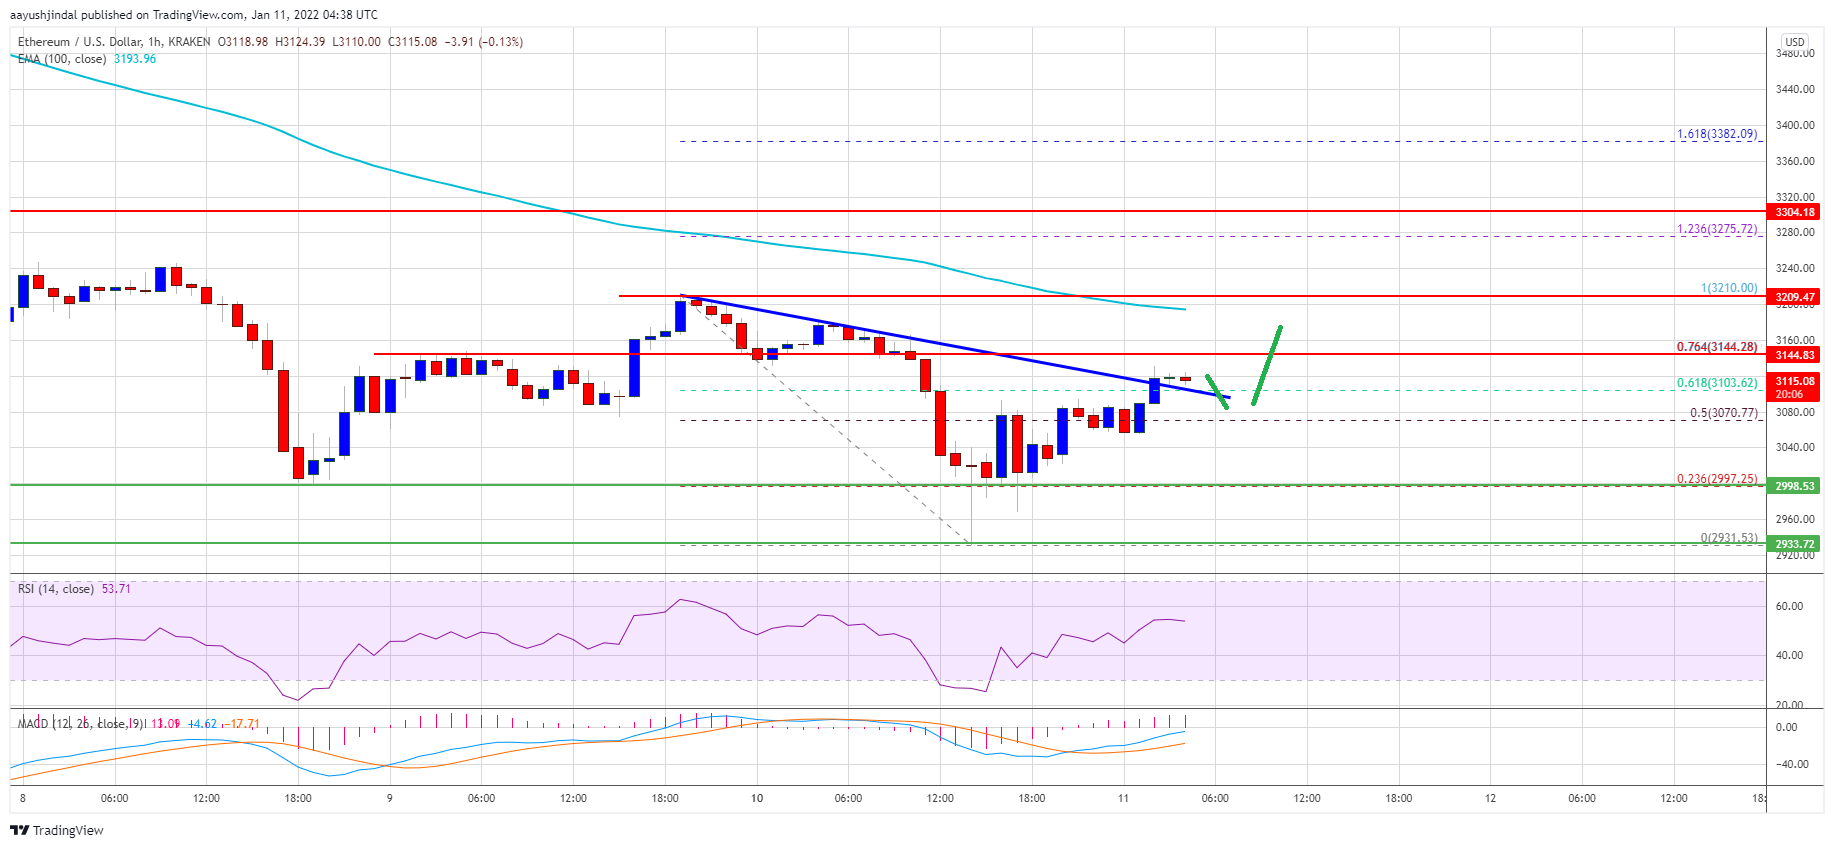
The price is trading below $3,200 and the 100 hourly simple moving average.
There was a break above a major bearish trend line with resistance near $3,110 on the hourly chart of ETH/USD (data feed via Kraken).
The pair could start a major recovery wave if there is a close above $3,200.
Ethereum Price Eyes Steady Recovery
Ethereum failed to climb above $3,200 and extended its decline. ETH declined below the $3,050 and $3,000 support levels to move further into a bearish zone.
The price spiked towards $2,920 and traded as low as $2,931. Recently, there was a sharp upside correction above the $3,000 and $3,050 levels. Besides, there was a break above a major bearish trend line with resistance near $3,110 on the hourly chart of ETH/USD.
Ether price settled above the 61.8% Fib retracement level of the downward move from the $3,210 swing high to $2,931 low. It is now consolidating above the $3,100 level.
On the upside, an immediate resistance is near the $3,145 level. It is near the 76.4% Fib retracement level of the downward move from the $3,210 swing high to $2,931 low. The next major resistance is near the $3,200 level and the 100 hourly simple moving average.
Source: ETHUSD on TradingView.com
A clear upside break above the $3,200 level could spark a decent recovery wave. The next key resistance is near the $3,300 level. Any more gains could send the price towards the $3,420 level in the near term.
Fresh Decline in ETH?
If ethereum fails to start a fresh increase above the $3,200 level, it could start another decline. An initial support on the downside is near the $3,060 level.
The first key support is now forming near the $3,000 level. A downside break below the $3,000 level might put a lot of pressure on the bulls. In the stated case, there is a risk of a new monthly low below the $2,931 level.
Technical Indicators
Hourly MACD – The MACD for ETH/USD is slowly losing pace in the bullish zone.
Hourly RSI – The RSI for ETH/USD is above the 50 level.
Buying an asset in a downtrend can be a risky maneuver because most investors struggle to spot reversals and as the trend deepens traders take on deep losses. In instances like these, being able to spot descending channel patterns can help traders avoid buying in a bearish trend.
A “descending channel,” also known as a “bearish price channel” is formed by drawing two downward trendlines, parallel to each other, which confine the price action of the asset.
Descending channel basics
In a downtrend, the price action forms a series of lower highs and lower lows. A descending channel is drawn by joining the lower highs and the lower lows using parallel trendlines. The main trendline is drawn first where two or more lower highs are connected. Then a parallel line, also called the channel line, is drawn connecting the lower lows.
The price action inside a descending channel continues to move south as bears sell on any relief rallies to the main trendline.
Descending channel pattern. Source: TradingView
The asset in the chart above is in a downtrend, forming lower highs and lower lows. The main trendline is drawn by joining two lower highs (marked as ellipses) while the parallel channel line is drawn by joining the two reaction lows.
When the price reaches the channel line, bulls believe that the price has become attractive and they buy, but the bears are in no mood to allow the bulls to have their way. They sell when the price reaches the main trendline and the trend remains down.
The trading inside the channel is usually random but bound between the two parallel lines. A break below the channel indicates that the bearish momentum has picked up and that could result in a spike down.
Conversely, a breakout of the descending channel suggests a possible change in trend. Sometimes these breakouts result in a new uptrend, but on other occasions the price action forms a range before resuming the downtrend.
Descending channel breakouts
THETA/USDT daily chart. Source: TradingView
The chart above shows THETA token in a descending channel where the main trendline is formed by joining the two lower highs made on April 16 and May 9. The parallel line drawn from the reaction low on April 18 forms the channel line.
As seen above, the price action is largely caged between these two lines. The bulls pushed the price above the channel on June 17 but could not sustain the higher levels. The bears again quickly pulled the price back into the channel, trapping the aggressive bulls.
There were a few spikes below the channel line but the long tails on the candlesticks show that bulls used these dips to buy. This shows how the lines act as strong support and resistance.
Finally, the price broke above the channel on July 24 and after a minor consolidation, the recovery continued. This confirmed a legitimate breakout, indicating a possible trend change.
XMR/USDT daily chart. Source: TradingView
Monero (XMR) topped out on June 23, 2019, and then started a downtrend. The main trendline of the channel was formed by connecting the lower highs on July 8, 2019, and Aug. 8, 2019, while the channel line was drawn from the low on July 16, 2019. The XMR/USDT pair continued to trade inside the channel until Jan. 4, 2020.
The bulls pushed and closed the price above the channel on Jan. 5, 2020. This signaled a possible change in trend. The target objective can be arrived at by adding the height of the channel to the breakout level.
In the above case, the depth of the channel was $31.50. Adding this to the breakout level at $51.80, gave a target objective of $83.30. The pair easily exceeded the pattern target and turned down from $96.90 on Feb. 15, 2020.
This suggests that traders should use the target as a guide but decide on closing the position after analyzing other supportive indicators and patterns.
Descending channel breakdowns
LUNA/USDT daily chart. Source: TradingView
Terra’s LUNA token topped out at $22.40 on March 21. Thereafter, it started trading inside a descending channel pattern. The bears pulled the price below the channel line on April 18 but they could not sustain the lower levels. The bulls pushed the price back into the channel on April 23 and trapped the aggressive bears.
The sellers again broke below the channel line on May 19. Attempts by the bulls to push the price back into the channel failed on May 20 and May 21, confirming a valid breakdown. The pattern target of the breakdown was $5.10 and the LUNA/USDT pair bottomed out at $3.91.
Take care to not mix up bull flags and descending channels
BTC/USDT daily chart. Source: TradingView
Bitcoin (BTC) rallied sharply from $17,572.33 on Dec. 11, 2020 to $41,950 on Jan. 8, 2021. Subsequently, the price corrected inside two parallel lines, which was a bullish flag pattern but could have been easily mistaken for a descending channel.
Thomas Bulkowski, author of the book Encyclopedia of Chart Patterns, says when a pattern is less than three weeks long, it is a flag, but longer than that can be considered as a channel.
In the above example, the correction lasted for just over three weeks and the price resumed its up-move after breaking out of the flag.
The views and opinions expressed here are solely those of the author and do not necessarily reflect the views of Cointelegraph.com. Every investment and trading move involves risk, you should conduct your own research when making a decision.
Smart contracts have been a revolutionary force in the blockchain industry because they have enabled the creation of decentralized finance protocols, nonfungible tokens and a new form of carrying out transactions without the need of a middleman.
Cardano (ADA) is one of the many projects that has been gaining momentum throughout 2021 and now that the project’s long-awaited smart contract capabilities are on the verge of becoming reality, the token is on the precipice of setting a new all-time high.
Data from Cointelegraph Markets Pro and TradingView shows that after bottoming at a low of $1.02 on July 20, the price of ADA has surged 139% to a multi-week high at $2.45.
ADA/USDT 1-day chart. Source: TradingView
Here’s a look at what some analysts and traders are saying about the recent price action for ADA and what token holders may want to keep an eye on in the short term.
A bullish upturn in the 50MA
The rapidly rising price of ADA has been hard for most traders to ignore, especially since multiple technical indicators have now flipped bullish.
One such indicator is the 50-day moving average (50MA), which is now pointed up after being on a downslope for roughly 2 months as highlighted in the following chart posted by pseudonymous Twitter user Pharmlord.
As seen in the chart above, once crossing above the 50-MA, ADA price doubled and is now on the verge of hitting a new all-time high at $2.46.
Flipping $2.30 to support is key
Insight into the important levels that ADA bulls need to keep an eye on was provided by Rekt Capital, a pseudonymous Twitter analyst who pinpointed the importance of the $2.30 level.
The $ADA dip gets bought aggressively and the rally continues
ADA is getting incredibly close to revisiting its final major resistance of $2.30 (black)
ADA has already managed to convincingly surpass a lower resistance zone shown in red on the chart above and is now it is attempting to break the May 16 all-time high at $2.46.
According to Rekt Capital:
“The only major resistance left before a new All-Time Highs is the black level ahead (~$2.30).”
Related: ADA hits $2 for the first time since May ahead of Cardano smart contract announcement
A cup and handle breakout will confirm the ATH
According to Twitter user ‘Fidzcrypto’, ADA is showing a distinct cup and handle formation on the daily timeframe.
Investopedia cites the cup and handle pattern as a technical indicator that resembles a cup with a handle, where the cup is in the shape of a “u” and the handle has a slight downward drift.”
The cup portion of the pattern can be seen on the chart between May 14 and Aug. 16, while the handle is seen in the price dip and recovery from Aug. 16 – Aug. 18.
According to Investopedia:
“The cup and handle is considered a bullish signal, with the right-hand side of the pattern typically experiencing lower trading volume. The pattern’s formation may be as short as seven weeks or as long as 65 weeks.”
The views and opinions expressed here are solely those of the author and do not necessarily reflect the views of Cointelegraph.com. Every investment and trading move involves risk, you should conduct your own research when making a decision.