In recent months, the Ethereum staking landscape has witnessed significant transformations, prompting a shift in investor preferences and reshaping the sector’s dynamics.
According to on-chain data researcher and strategist at 21Shares, Tom Wan, key metrics indicate a notable change in the approach towards Ethereum staking, with restaking gaining prominence as a preferred method.
Ethereum Restaking Landscape
Wan’s observations, shared on the social media platform X (formerly Twitter), highlight a steady increase in ETH staking deposits from restaking, rising from 10% to 60% since 2024.
Restaking can be accomplished in two primary ways: through ETH natively restaked or by utilizing a liquid staking token (LST). By staking their ETH, users secure additional applications known as Actively Validated Services (AVS), which yield additional staking rewards.
A significant player in the staking landscape is EigenLayer, which has emerged as the second-largest decentralized finance (DeFi) protocol on the Ethereum network.
EigenLayer has achieved a significant milestone with the release of EigenDA, its data availability Actively Validated Service (AVS), on the mainnet.
According to a research report by Kairos, this launch marks the beginning of a new era in restaking, where liquid restaking tokens (LRTs) will become the dominant way for restakers to do business.
Currently, 73% of all deposits on EigenLayer are made through liquid restaking tokens. The report highlights that the growth rate of LRT deposits has been significant, increasing by over 13,800% in less than four months, from approximately $71.74 million on December 1, 2023, to $10 billion on April 9, 2024, demonstrating the growing confidence in EigenLayer’s approach to restaking and contributing to the shifting tides in Ethereum’s staking landscape.
According to Wan, the rise of liquid restaking protocols has also contributed to a decline in the dominance of Lido (LDO), a staking service solution for Solana (SOL), Ethereum, and Terra (LUNC).
On the other hand, Etherfi has emerged as the second-largest stETH withdrawer, with 108,000 stETH withdrawn through the first quarter of 2024. This trend exemplifies the increasing popularity of liquid restaking protocols, allowing stakers to withdraw and actively utilize their staked assets while still earning rewards.
Ether.fi Set To Surpass Binance In ETH Staking
Data provided by Wan also shows a decline in the dominance of centralized exchanges (CEXs) in ETH staking. Since 2024, CEXs have seen their share of staking decline from 29.7% to 25.8%, a significant drop of 3.7%.
As a result, the decentralized staking provider Kiln Finance has surpassed Binance and become the third-largest entity in terms of ETH staking. With Ether.fi poised to follow suit, it is expected to surpass Binance’s position shortly, according to the researcher.
In short, these developments signify a paradigm shift in the Ethereum staking landscape, with re-staking methodologies gaining traction and decentralized protocols like EigenLayer and Ether.fi challenging the dominance of established players.
The 1-D chart shows ETH’s price volatility for the past few days. Source: ETHUSD on TradingView.com
As of this writing, ETH’s price stands at $3,500. It has been exhibiting a sideways trading pattern over the past 24 hours, remaining relatively stable compared to yesterday.
Featured image from Shutterstock, chart from TradingView.com
Disclaimer: The article is provided for educational purposes only. It does not represent the opinions of NewsBTC on whether to buy, sell or hold any investments and naturally investing carries risks. You are advised to conduct your own research before making any investment decisions. Use information provided on this website entirely at your own risk.
The Ethereum market is buzzing after a long-dormant “whale” – a major investor holding a vast amount of cryptocurrency – resurfaced and transferred a significant amount of ETH to the Kraken exchange. This move has sparked speculation about a potential price drop, but wider market trends suggest a more complex picture.
On-chain analytics firm Spot On Chain has disclosed that the investor, who participated in Ethereum’s Initial Coin Offering (ICO) in 2014, recently deposited 1,069 ETH, valued at roughly $3.56 million, to Kraken.
Traditionally, deposits to exchanges are seen as a sign of intent to sell, potentially putting downward pressure on the price of ETH.
This whale’s activity is particularly noteworthy because of their participation in the Ethereum ICO. Back in 2014, they acquired 12,566 ETH at a meager $0.30 per token. The recent transfer represents just a fraction of their holdings, but the sale price – over $3,300 per ETH – signifies a massive profit for the early investor.
An #Ethereum#ICO participant returned after 1.12 years to deposit 1,069 $ETH ($3.56M) to #Kraken at $3,329 3 hours ago.
The whale received 12,566 $ETH at #Ethereum Genesis in Jul 2015, at an ICO price of ~$0.31,
While the whale’s move might suggest a potential sell-off, on-chain data reveals a broader trend that could offset its impact. According to IntoTheBlock, a blockchain analytics company, the past quarter witnessed a significant outflow of ETH from cryptocurrency exchanges, totaling a staggering $4 billion.
This movement suggests that many investors are accumulating ETH, potentially anticipating future price increases.
Ether market cap currently at $409 billion. Chart: TradingView.com
Dencun Upgrade Fuels Ethereum Network Activity
The news comes on the heels of Ethereum’s successful Dencun upgrade, implemented in March 2024. The upgrade aimed to address the network’s scalability issues, specifically targeting high transaction fees and slow processing times.
Early signs appear positive, with IntoTheBlock reporting a surge in activity on the main optimistic rollups (Layer 2 scaling solutions) following the upgrade.
Weekly transaction volume reached highs of 32 million, indicating increased network usage. While gas prices have risen recently, they were initially significantly lower on many Layer 2 solutions after the upgrade.
Market Uncertainty Remains
The combined effect of the whale’s sale, the wider accumulation trend, and the Dencun upgrade’s impact on network activity make it difficult to predict the short-term direction of the Ethereum market.
While the whale’s sale could trigger a price dip, the broader accumulation trend suggests underlying bullish sentiment. The Dencun upgrade’s success in reducing transaction fees and increasing network usage could further bolster investor confidence.
Featured image from Pexels, chart from TradingView
Disclaimer: The article is provided for educational purposes only. It does not represent the opinions of NewsBTC on whether to buy, sell or hold any investments and naturally investing carries risks. You are advised to conduct your own research before making any investment decisions. Use information provided on this website entirely at your own risk.
The U.S. Commodity Futures Trading Commission (CFTC) has filed a lawsuit against Kucoin, emphasizing the classification of bitcoin, ethereum, and litecoin as commodities. The enforcement action, launched in the U.S. District Court for the Southern District of New York, accuses Kucoin of multiple regulatory breaches involving these digital assets. Kucoin’s Legal Battles Shine a Bright […]
Blocknative, a real-time Ethereum (ETH) infrastructure platform, has newly introduced features including transaction bundle send, cancellation, and replacement support for the Blocknative Builder.
Searchers can now submit MEV bundles privately to the Blocknative Builder to be included on-chain.
This market utility builds upon Blocknative’s reliable, real-time infrastructure that is systematically important to the Ethereum ecosystem.
“MEV bundle control is an important element of our block-building capabilities. As Ethereum evolves, we remain committed to providing real-time infrastructure that supports transparency, accessibility, and decentralization block by block. To reduce friction and facilitate adoption, we have prioritized ease of use by ensuring that our API-level implementation is cross-compatible with the broader builder ecosystem.” – Matt Cutler, CEO & Co-Founder of Blocknative
Searchers can quickly add the Blocknative Builder to their bundle workflow. The bundle RPC endpoint uses direct payments instead of gas prices to make payments conditional on their transaction succeeding, thus avoiding having to pay for failed bids.
With over 269,000 validators connected to the Blocknative Relay via MEV-Boost, searchers can use the Blocknative bundle RPC endpoint to increase their Builder reach and increase the likelihood that their bundles successfully get on-chain.
Searchers can learn more here or interact with the RPC endpoint here.
The world’s second most dominant digital asset, Ethereum witnessed significant buying pressure on Friday as the cryptocurrency spiked by almost 5% in 24 hours. With rising prices, short ETH trading positions liquidations also increased substantially during the mentioned period.
The data posted by Coinglass shows that more than $50 million worth of positions related to Ethereum were liquidated in the last 24 hours. The number includes the liquidation of approximately $40 million worth of short positions.
Ethereum’s price remained under pressure since November 2021. In January 2022, the crypto asset reached a low of almost $2,100, down by more than 50% from its all-time high in November 2021. Since the start of 2022, Ethereum faced several challenges including the rise in short trading positions around the digital asset.
However, a sudden spike in the crypto market has caused a sharp jump in the liquidation of short trading positions. While ETH topped the list, bearish traders of digital currencies like BTC, LUNA, and SOL also faced the heat with massive liquidations.
Large Ethereum Transactions
With growing demand and a jump in its price, the Ethereum network saw a spike in $100,000+ transactions. According to Santiment, an on-chain analysis platform, ETH whale transfers have reached the highest level in nearly 1 month.
“ETH has surged back above $2,900 for the first time since March 2nd, and whale transactions are on the rise big time. Yesterday was the first day with over 7,000 $100k+ transactions on the ETH network since the war news broke,” Santiment mentioned in a recent update.
ETH outflows from leading digital exchanges have increased as well. Recently, large Ethereum holders shifted the crypto asset in enormous amounts from exchanges to cold storage. Earlier this week, ETH 2.0 deposit contract crossed 10.4 million staked Ethereum.
The last time ETH Denver was held in person, ETH’s market cap stood at $30B, DeFi hadn’t had its breakout summer, and few people outside of the 6,000 attendees knew what an NFT was. Fast forward to 2022 and a 10x in ETH’s market cap, the rise of NFTs, a DAO resurgence, and a year where Ethereum did more transactional volume than Visa, a record crowd of 12,000 in Colorado were met with an entirely different energy.
What had historically been an event for hackers and coders received an infusion of artists and creatives, as well as a governor, a former presidential candidate, and a heavy dose of EDM — a reflection of Ethereum and crypto’s growing awareness within the mainstream.
Despite the new faces, ETH Denver retained its authentic quirky disposition, complete with bright neon colors and Vitalik dressed as a “Bufficorn”. Beyond a lone Doge Lambo, the main event was mostly free of flash and still felt authentically Ethereum.
Attendee sentiment
Even amidst a 50% market drawdown from late November highs and multi-hour long check-ins in the frigid cold, builder energy was sky high. Where Ethereum was still finding its footing during last ETH Denver, this year’s event featured heavy discussion across all of the new verticals thriving today: DeFi, NFTs, DAOs, gaming, and more.
It was also apparent just how much private capital is still flowing into crypto, undeterred by macro market headwinds: with seed stage deals raising at a minimum $50M and seed token rounds going for $100M+ (no shipped code needed), one might argue too much. In either case, it’s clearly a builders market.
Real Politik
In addition to investor and builder excitement, there was also a noticeable presence from mainstream politicians: most notably, Colorado Governor Jared Polis and the Forward Party’s Andrew Yang. With crypto and Web3’s growing popularity, it seems many in government are seeing the upside to embracing this emerging constituency.
In addition to posing with Vitalik, Gov. Polis announced during the conference that Colorado will accept crypto as payment for taxes in addition to making Colorado, “the first digital state” with favorable regulations for the crypto economy. This mirrors the positions of other crypto-forward governors like Miami’s Francis Suarez and New York’s Eric Adams.
Photo credit: Westword
In a surprise appearance, Andrew Yang took the stage with Bankless’s David Hoffman, sharing his thoughts on why Web3 represents “the biggest anti-povery opportunity of our time.” His appearance came on the heels of his Lobby3 initiative, which will advocate for thoughtful regulation in Washington to support crypto innovation.
All of the while, Biden’s executive order on crypto regulation loomed large (however if you bumped into CoinCenter’s Neeraj he would have told you that the EO is nothing to panic over). Either way, it’s clear that crypto has entered the fore of the American political discussion.
NFT Mania
Beyond the bullish builder sentiment, private investor froth, and political participation, NFTs were everywhere in Denver. NFT art installations, musicians performing with their NFTs on display, and some events even requiring NFTs to gain entry (shoutout ecodao).
POAP (Proof of Attendance Protocol) NFTs, which give people digital mementos commemorating attendance of a particular event by scanning a QR code, were particularly pervasive. The inventive ways different projects found to engage via POAPs suggests that they may be the next mainstream crypto community use case.
If you were mingling at any of the NFT centric events, odds are you bumped into a former FAANG employee newly entering the NFT space. A sign that despite the macro market downturn, NFT mania is still in full swing and the brain drain from Web2 to Web3 continues.
Signs of DAObt
Following a year that saw ConstitutionDAO capture global attention, DAOs have regained much of the crypto limelight. Conference booths were packed with projects building DAO infrastructure and discussions on how decentralized autonomous can rewire the world were prevalent.
While DAO enthusiasm was evident, many noted that DAO participants were starting to show signs of fatigue with many DAOs struggling to retain contributors. Joseph Delong, former CTO of SushiSwap who notably left the decentralized project, gave a memorable talk on why DAOs simply need more structure to be effective (also discussed in our recent podcast with Orca Protocol’s Julia Rosenberg).
With over 1B in startup equity for DAO tooling and under 200 DAOs, it begs the question: is there enough DAO to go around?
The long term outlook of DAOs seems to be bright, but the industry is still grappling with how exactly DAOs should function. Given that there’s no standardization around DAO operation, it’s hard to know what tools they actually need. As such, the DAO infrastructure sector will likely see a lot of turbulence over the near to medium term.
The Merge
After years in the making, experts stated that Ethereum’s transition to proof-of-stake is expected to happen in Q2 or Q3 this year. As a quick refresh, Ethereum’s PoS chain (the beacon chain) has been operational since December 2020, however all applications still live on the proof of work chain. The merge basically consists of migrating these applications to the PoS chain.
As such, the merge was a major point of discussion for devs this year. If all goes well, ETH holders won’t have to do anything, but developers and infrastructure providers are in preparation mode. This includes running testnets and conducting dry runs in anticipation for the real thing.
The Ethereum ecosystem is making a big bet on PoS in conjunction with layer 2 scaling solutions (rollups). In a post-merge world, Ethereum will transition to become a settlement layer for large transactions while most user activity is pushed to layer 2. This will create an environment where all EVM compatible layer 1s compete with ETH L2s for users and developer mindshare.
Also prepping for the merge, is Coinbase Cloud, which powers a portion of Coinbase’s ETH staking product as well as node infrastructure for many players in the space. Cloud developers showed up in force hosting a hackathon, a variety of panels, workshops, and a party for over 500 attendees. Learn more about how Coinbase Cloud is thinking about client diversity ahead of the merge here.
A builders market
In the days since ETH Denver wrapped, the market drawdown intensified as Russia escalated the situation in Ukraine. While crypto has rebounded, markets will likely remain shaky given the uncertainty of the current geopolitical situation. Regardless, teams building the next generation of Ethereum and Web3 remain well funded and the building will continue.
As evident by the increased diversity of both projects and participants at this year’s conference, what gets built on Ethereum will keep venturing out in a myriad of new exciting directions.
Ethereum crumbled with the market during the last crash and is yet to recover to previous levels. The crash was characterized by sell-offs and liquidations from all angles, which continued even when the price dumped further. Fear of a bear market sparked this as investors wanted to get out before the price fell further. But not everyone followed this trend of dumping.
Whales have always been known to move differently from smaller investors when it comes to the crypto market and this time was no different. While investors panic sold their holdings at low prices, these whales quietly gobbled up the ETH being dumped on the market, increasing their dominance in the market once again.
Whales Fill Up On ETH
In the last few weeks, whales have taken advantage of the declining market values to buy cryptocurrencies at what can be essentially said to be a discount. The price of Ethereum had dumped as low as $2,100 following the crash, leaving even more room for the whales to increase their holdings. Smaller investors had followed suit but only after whales had bought hundreds of millions of dollars worth of ETH.
Related Reading | Bitcoin Whales Take Advantage Of Market Crash To Gobble Up Millions In BTC
During this time, the number of addresses holding more than 10,000 ETH on their balances had also increased significantly. These whales had altogether purchased more than $500 million in ETH in only a couple of weeks.
ETH recovers to $2,400 post-crash | Source: ETHUSD on TradingView.com
This renewed support from whales and smaller investors had worked to slow down the decline of the digital asset. But proved to be not enough to spark a rebound back up to previous values. Despite growing support from these large investors, the market has remained in extreme fear, pointing to intense wariness from investors. This has caused them to hold back from putting any more money in the market.
Ethereum Struggles To Stay Afloat
Since the crash towards the low $2,100, Ethereum has had a hard time recovering in the market. While a bounce-back that was triggered by pioneer cryptocurrency bitcoin saw it recover above $2,400, it has not recorded much in the way of upward momentum since then.
Related Reading | Which Cryptocurrencies Suffered The Worse Collapse Since All-Time Highs?
Indicators point to the week playing out with continued low momentum for the second-largest cryptocurrency by market cap. It had previously tested the $2,700 point on Wednesday but had promptly taken a beating down that brought it back to $2,400.
ETH is trading below its 5-day, 20-day, 100-day, and 200-day moving averages for the first time in a year. Market sentiments remain bearish with more downtrend expected to come as support from whales taper off.
As of the time of writing, the digital asset is trading at $2,461, down 2.97% in the last 24 hours. Trading volume is up significantly over the same time period but is yet to translate into a higher value for the asset.
Featured image from Nairametrics, chart from TradingView.com
Fees.wtf is a simple service that shows Ether (ETH) users their lifetime spend on Ethereum blockchain transactions by measuring gas. You plug in your wallet address on their website and they tell me how much gas you spent.
The project released their token, WTF, in an airdrop Friday at midnight. Essentially, users would be able to claim WTF tokens as well as a “Rekt” NFT for 0.01 ETH. The Rekt NFT grants lifetime access to the pro version of fees.wtf.
According to their Discord announcement, the initial launch would offer 100 million of WTF and the “circulating supply will be the main attraction in the tokenomics.” However, it didn’t quite go to plan.
Following a series of frantic trading behavior between bots in the opening hours of the airdrop, one bot ran off with a reported 58 ETH, or $180,000. On Etherscan, 58 ETH was drained from the wrapped ETH (WETH) to the WTF liquidity pool.
Social media channels were quick to respond because many airdrop participants lamented losing thousands of dollars in ETH. The WTF team chimed in two hours after the airdrop to calm their ranks:
“Immediately on launch there was only a tiny bit of liquidity and there were ape bots that were chucking in 100s of ETH into a pool with an ETH or two of liquidity. They also had high slippage and ended up being sandwiched by the other bots which essentially drained all their ETH.”
Basically, within five minutes of the token launch, poor liquidity pool management from the WTF devs left the liquidity pool exposed. As there was low liquidity, bots were able to manipulate the price of WTF to then sell for WETH.
The bots would battle it out till one winner would take home the pot. In effect, the bot stole from users who provided liquidity to the pool, trying to claim their WTF tokens and Rekt NFT. The victor managed to send an “ultra-fast transaction at 3,000 Gwei”, making a 6x return on their initial investment.
The WTF team sent out another Discord update two hours after the airdrop, stating that “The core contracts are all fine, this was a war on Uniswap.” The team added, “We hope no one was affected by it.” However, as has become a common occurrence in airdrops of late, lots of users lost a lot of money.
The price graph of the token since launch paints a thousand words. The initial spike shows the bot activity, swiftly followed by a 10x loss in value.
The official WTF Discord group is brimming with users sharing stories of losing money. Some are “shaking” with rage while death threats and lawsuit claims are rife.
One Etherscan transaction points to one user losing 42 ETH, or $135,000, for 0.000044170848308398 WTF, effectively $0.01.
As daylight dawns on the project, some Twitter users have called out the project as a Ponzi scheme. The referral element to the project is spurious. Referrers of the WTF project claim a 50% on fees “to make wtf go viral,” while the WTF team earns 4% from each transfer. In total, the WTF team claimed almost half a million in token transfer fees in a little over 8 hours.
Twitter user Lefteris Karapetsas didn’t mince his words:
Summing up.
WTF “team” made an app any dev can do in 1 hour Slapped a token + ponzinomics on it Anons aped without thinking and lost ETH in gas and claim fees Team has so far made 116 ETH + 6,168,806 WTF. Roughly around $855,665 and this is getting bigger by the second
— Lefteris Karapetsas | Hiring for @rotkiapp (@LefterisJP) January 14, 2022
The WTF project states merely that the supply of tokens is “deflationary”, and that 40 million WTF tokens will go to their treasury. There is not a great deal of detail regarding the token distribution. Meows.ETH concluded their Twitter thread with a zen approach to the controversial project launch:
“If you were fortunate enough to claim a big amount of $WTF and cash it out for a profit, be happy. Unless you’re attempting to bot the initial liquidity, don’t FOMO into buying a newly launched altcoin with high slippage.”
Bitcoin (BTC) and the U.S. equity markets fell sharply on Jan. 5, reacting negatively to the minutes from the Federal Reserve’s December FOMC meeting, which showed that the members expect the balance sheet reduction to start after the Fed begins hiking interest rates in early 2022.
Adding to the negative sentiment was the shutdown of the world’s second-biggest Bitcoin mining hub in Kazakhstan, where the internet has been shut down following massive protests by citizens. This caused a dip of about 13.4% in the Bitcoin network’s overall hash rate from 205,000 petahash per second (PH/s) to 177,330 PH/s.
According to Galaxy Digital Holdings CEO Mike Novogratz, the current decline was with low volumes and he believes that the markets will be volatile in the next few days. Novogratz suggests that a huge amount of “institutional demand” was waiting on the sidelines and he expects Bitcoin to bottom out in the $38,000 to $40,000 zone.
Could Bitcoin and major altcoins continue to face selling or will they bounce off strong support levels? Let’s study the charts of the top-10 cryptocurrencies to find out.
BTC/USDT
The range-bound action in Bitcoin resolved to the downside on Jan. 5 when bears pulled the price below the strong support at $45,456. This suggests that supply exceeds demand.
BTC/USDT daily chart. Source: TradingView
There was a meek attempt to defend the $42,500 support on Jan. 6 but sustained selling has pulled the price close to the next support at $39,600. This leg down has invalidated the positive divergence that was forming on the relative strength index (RSI).
The downsloping moving averages and the RSI near the oversold zone suggest that bears are in control. If bears sink and sustain the price below $39,600, the BTC/USDT pair could nosedive to $30,000.
On the contrary, if the price rebounds off $39,600, the bulls will again try to push the pair above the 20-day exponential moving average ($46,811). Such a move will be the first indication that the downtrend could be ending.
The bullish momentum could pick up on a break and close above the 50-day simple moving average ($50,610).
ETH/USDT
Ether (ETH) turned down from the 20-day EMA ($3,756) on Jan. 5 and plunged below the Dec. 4 intraday low at $3,503.68. This suggests that bears have reasserted their supremacy.
ETH/USDT daily chart. Source: TradingView
The downsloping moving averages and the RSI in the oversold zone suggest that bears are in command. If bears sustain the price below $3,250, the decline could extend to the support line of the channel.
The bulls will attempt to defend this level and push the price to the resistance line of the channel. A break and close above the channel will signal a change in trend.
Alternatively, if bears sink the price below the channel, the ETH/USDT pair could decline to the strong support at $2,652.
BNB/USDT
Binance Coin (BNB) broke below the strong psychological support at $500 on Jan. 5. Follow-up selling has pulled the price to the next support at $435.30.
BNB/USDT daily chart. Source: TradingView
If the price bounces off the current level, the BNB/USDT pair could rally to $500 where the bears are likely to mount a stiff resistance. The downsloping moving averages and the RSI in the oversold zone suggest that bears are in control.
If the $435.30 support gives way, the pair could extend its decline to $392.20 and later to $320. This negative view will be negated if the price breaks and sustains above the channel. Such a move could open the doors for a possible move to $575.
SOL/USDT
Solana (SOL) plummeted below $167.88 and the Dec. 13 intraday low at $148.04 on Jan. 5. This indicated that bears have reasserted their dominance.
SOL/USDT daily chart. Source: TradingView
The selling has continued and the bears will now try to pull the SOL/USDT pair to the strong support at $116. This level could attract strong buying from the bulls but the relief rally is likely to face selling near the 20-day EMA ($170).
Such a move will indicate that the sentiment remains negative and traders are selling on rallies. That could increase the likelihood of a break below $116. The next stop may be the support line of the channel.
The buyers will have to push and sustain the pair above the resistance line of the channel to signal that the downtrend could be ending.
ADA/USDT
Cardano (ADA) turned down from the 20-day EMA ($1.33) on Jan. 5 and dropped to the strong support at $1.18. The bulls have successfully defended this level but have failed to push the price above the 20-day EMA.
ADA/USDT daily chart. Source: TradingView
If bears pull the price below $1.18, the ADA/USDT pair could drop to the critical support at $1. This is an important support to watch out for because if it cracks, the selling momentum could pick up and the pair could slide to $0.68.
On the contrary, if bulls drive the price above the moving averages, the pair could rise to the resistance line of the channel. A break and close above the channel will signal a possible change in trend. The pair could then rally to $1.87.
XRP/USDT
XRP broke below the $0.75 support on Jan. 5 but the long tail on the candlestick suggests that bulls purchased this dip. However, a minor negative is that the buyers have not been able to build upon the rebound.
XRP/USDT daily chart. Source: TradingView
The XRP/USDT pair formed a Doji candlestick pattern on Jan. 8 and the bulls are currently attempting to sink the price below $0.75. If that happens, the downtrend could resume and the pair may drop to $0.60.
The downsloping moving averages and the RSI in the negative zone indicate that bears are in command. Contrary to this assumption, if the price rebounds off the current level, the bulls will attempt to push the pair above the moving averages.
If they succeed, it will suggest that the selling pressure may be reducing. The pair could then rise to $1.
LUNA/USDT
Terra’s LUNA token plummeted below the 20-day EMA ($81) on Jan. 5, indicating that short-term traders may have booked profits after bulls failed to clear the hurdle at $93.81.
LUNA/USDT daily chart. Source: TradingView
The bears have pulled the price to the 50-day SMA ($69), which may act as a strong support. If the price rebounds off the current level, the bulls will try to push the LUNA/USDT pair to the downtrend line of the descending channel.
A break and close above the channel will indicate that the correction may be over. The bulls will then try to push the price to $93.81. On the contrary, a break and close below the 50-day SMA could intensify selling and the pair may drop to the psychological support at $50.
Related: Bitcoin and Ether heading $100K and $5K in 2022: Bloomberg Intelligence
DOT/USDT
Polkadot (DOT) is range-bound in a downtrend. The price has been oscillating between $22.66 and $32.78 for the past few days.
DOT/USDT daily chart. Source: TradingView
The 20-day EMA ($28) has started to turn down and the RSI has dipped into the negative territory, suggesting that bears have the upper hand. If sellers sink and sustain the price below $22.66, the DOT/USDT pair could plunge to $16.81.
Contrary to this assumption, if the price rebounds off $22.66, the bulls will try to push the pair to $32.78. A break and close above this level could signal a possible change in trend. The pair could first rise to $40 and later to $44.
AVAX/USDT
Avalanche (AVAX) broke below the $98 support on Jan. 5 and has dropped to the uptrend line of the symmetrical triangle today. The bulls will attempt to defend this level and push the price back to the downtrend line.
AVAX/USDT daily chart. Source: TradingView
The 20-day EMA ($104) has turned down and the RSI is below 38, indicating that rallies are likely to be sold into. If the bounce off the current level turns down either from $98 or from the 20-day EMA, the possibility of a break below the triangle increases.
The AVAX/USDT pair could then decline to the $75.50 support where the bulls will try to arrest the decline. This negative view will invalidate if the price turns up and breaks above the triangle. The pair could then rise to $128.
DOGE/USDT
Dogecoin (DOGE) dipped below the $0.15 support on Jan. 5 but the long tail on the candlestick shows that bulls defended this level. That was followed by a Doji candlestick pattern on Jan. 6, indicating indecision among the bulls and the bears.
DOGE/USDT daily chart. Source: TradingView
The bears tried to resolve the uncertainty to the downside today but the bulls are not willing to relent. However, unless buyers quickly push the DOGE/USDT pair above the 20-day EMA ($0.17), the risk of a break and close below $0.15 increases.
If that happens, the pair could slide to $0.13 and then to $0.10. Alternatively, if bulls push the price above the 20-day EMA, it will suggest that buyers are attempting a comeback. The pair could then rise to $0.19 and if bulls clear this hurdle, the rally may extend to $0.22.
The views and opinions expressed here are solely those of the author and do not necessarily reflect the views of Cointelegraph. Every investment and trading move involves risk. You should conduct your own research when making a decision.
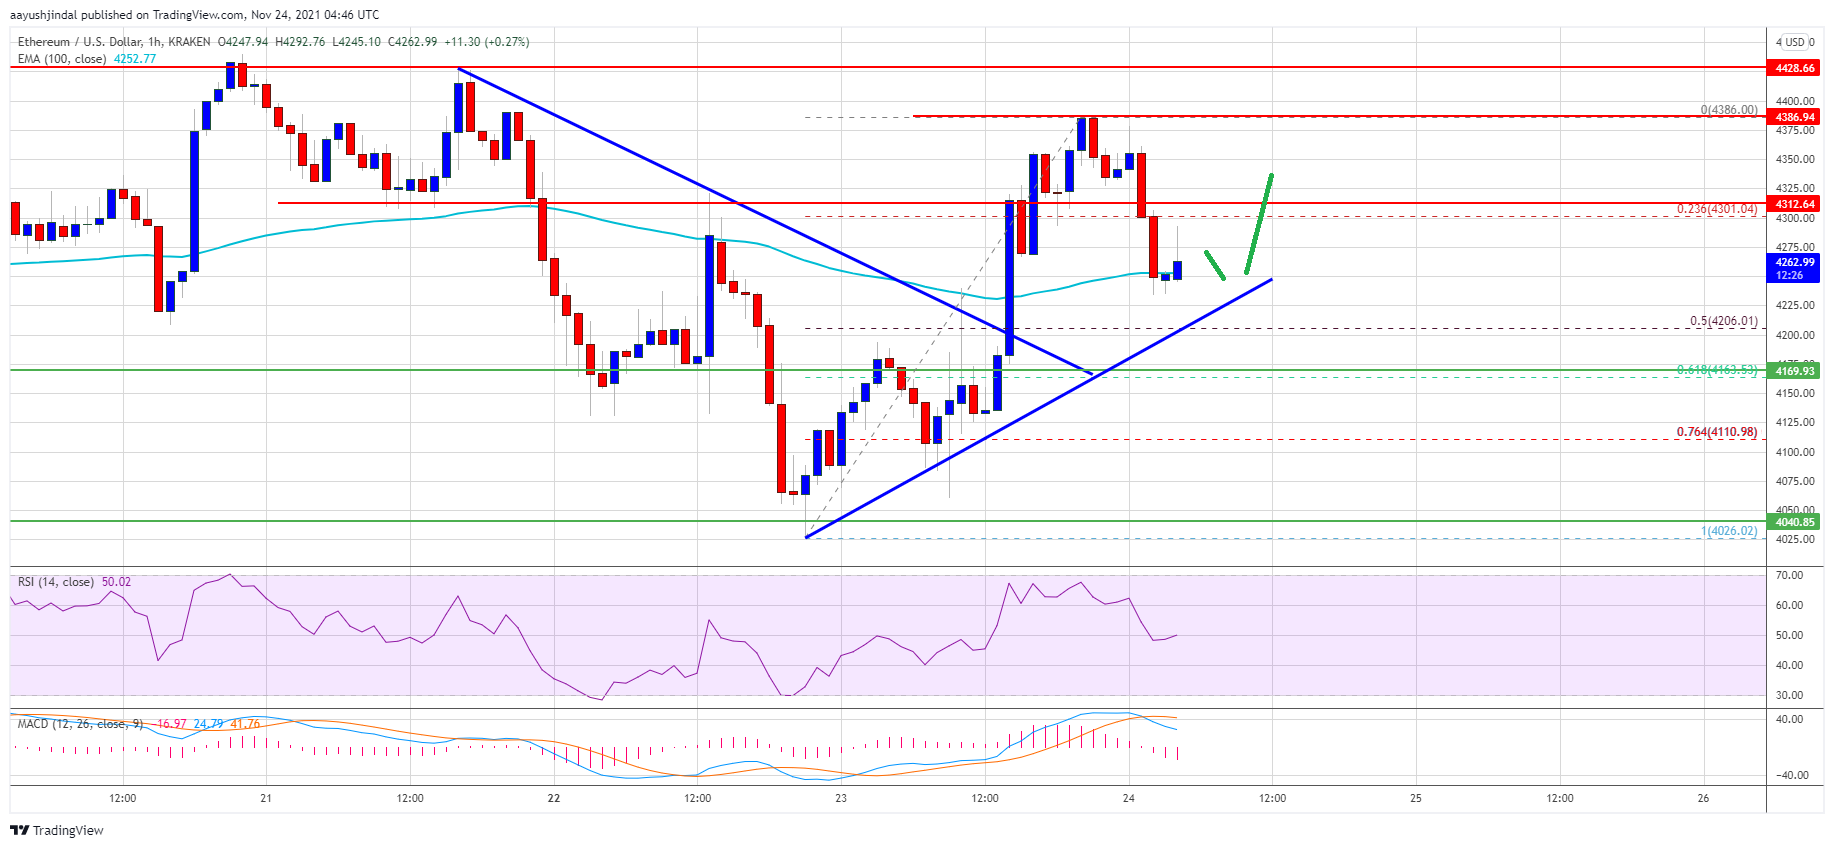
Ethereum remained stable above $4,050 against the US Dollar. ETH could gain bullish momentum once it clears the $4,325 and $4,350 resistance levels.
Ethereum is showing a few positive signs above the $4,200 level.
The price is now trading above $4,200 and the 100 hourly simple moving average.
There was a break above a major bearish trend line with resistance near $4,205 on the hourly chart of ETH/USD (data feed via Kraken).
The pair could extend gains if there is a clear break above the $4,350 resistance zone.
Ethereum Price Is Recovering
Ethereum remained strong above the $4,050 support level, unlike bitcoin. ETH price formed a base and started a steady recovery wave above the $4,120 resistance zone.
There was a clear break above the $4,200 resistance zone and the 100 hourly simple moving average. Besides, there was a break above a major bearish trend line with resistance near $4,205 on the hourly chart of ETH/USD.
The pair climbed higher above the $4,300 resistance zone and formed a high near $4,386. It is now correcting gains below the $4,300 level. There was a break below the 23.6% Fib retracement level of the upward move from the $4,026 swing low to $4,386 high.
Source: ETHUSD on TradingView.com
Ether price is now trading above $4,200 and the 100 hourly simple moving average. An initial resistance on the upside is near the $4,300 level.
The first major resistance is near the $4,350 level. A close above the $4,300 and $4,350 levels could start a fresh increase in the near term. In the stated case, the price might rise towards the $4,450 level. Any more gains could lift the price towards the $4,500 barrier in the near term.
Fresh Drop in ETH?
If ethereum fails to start a fresh increase above the $4,350 level, it could start a fresh decline. An initial support on the downside is near the $4,220 level. There is also a connecting bullish trend line near $4,220 on the same chart.
The first key support is now forming near the $4,200 level. It is close to the 50% Fib retracement level of the upward move from the $4,026 swing low to $4,386 high. A downside break below the $4,200 support might push the price further lower.
Technical Indicators
Hourly MACD – The MACD for ETH/USD is losing pace in the bullish zone.
Hourly RSI – The RSI for ETH/USD is now near the 50 level.


 The U.S. Commodity Futures Trading Commission (CFTC) has filed a lawsuit against Kucoin, emphasizing the classification of bitcoin, ethereum, and litecoin as commodities. The enforcement action, launched in the U.S. District Court for the Southern District of New York, accuses Kucoin of multiple regulatory breaches involving these digital assets. Kucoin’s Legal Battles Shine a Bright […]