On-chain shows Bitcoin miner outflows have been elevated recently, suggesting miners were involved in the recent selloff that took the price of the crypto below $42k.
Bitcoin Miner Outflows Spiked Up Before The Crash Below $42k
As pointed out by an analyst in a CryptoQuant post, BTC miners seem to have been one of the sellers behind the price drop to $42k.
The relevant indicator here is the “miner outflow,” which measures the total amount of Bitcoin exiting wallets of all miners.
When the value of this metric spikes up, it means miners are moving a large number of coins out of their wallets right now. Such a trend can be bearish for the price of the crypto as it may be a sign of dumping from these original whales.
Related Reading | Ark CEO Cathie Wood Is As Bullish As Ever, Sees Bitcoin Hitting $1 Million By 2030
On the other hand, low values of these outflows suggest a normal or healthy amount of selling from miners. This trend, when sustained, can prove to be bullish for the BTC price.
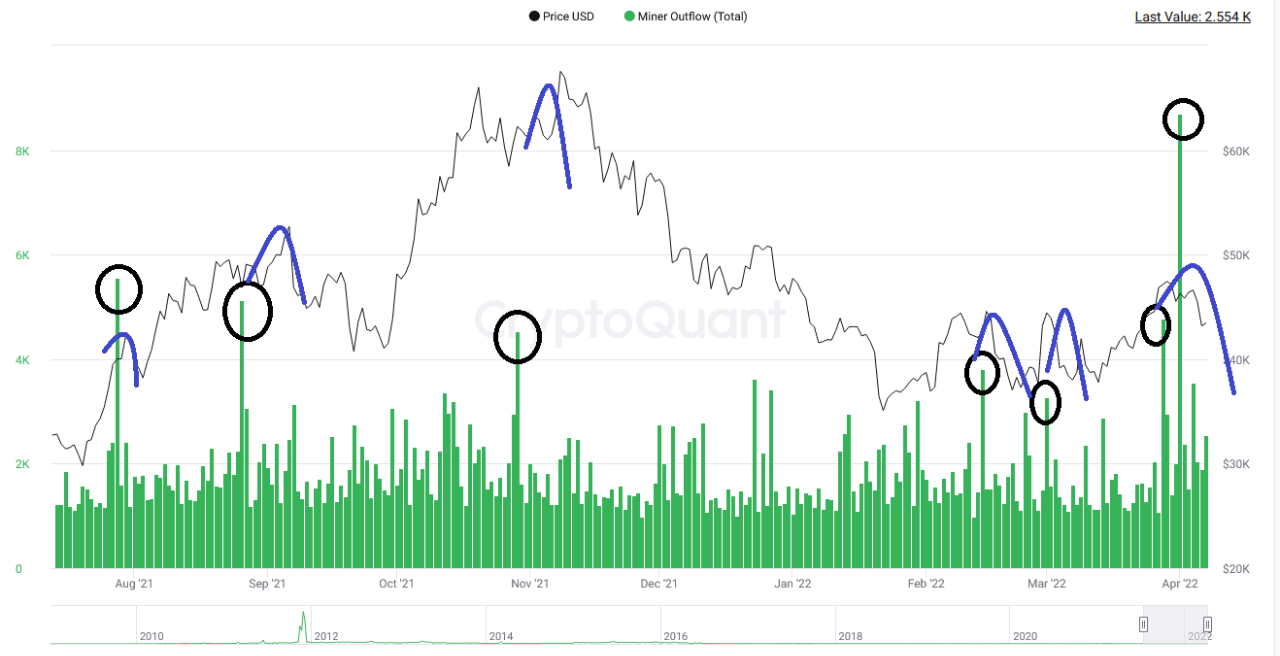
Now, here is a chart that shows the trend in the Bitcoin miner outflows over the past several months:
Looks like the value of the indicator has shot up recently | Source: CryptoQuant
As you can see in the above graph, the Bitcoin miner outflows seem to have shown spikes in recent weeks, just before the selloff.
This would suggest that miners look to have played a role in the dump recently, sending the price of the coin diving below the $42k level.
A trend like this has been observed a few times in the past several months already, as the quant has marked in the chart.
Related Reading | Mexico’s Third Richest Man Says No To Bonds, Yes To Bitcoin
Currently, it’s unclear whether Bitcoin miners have already calmed down or if more selling is coming in the next few days.
BTC Price
After around twenty days of holding strongly above the level, Bitcoin’s price is now once again revisiting the $41k mark.
At the time of writing, the coin’s price floats around $41.1k, down 11% in the last seven days. Over the past month, the crypto has gained 4% in value.
The below chart shows the trend in the price of BTC over the last five days.
The value of BTC seems to have taken a plunge over the past twenty-four hours | Source: BTCUSD on TradingView
Due to this sharp downtrend in the price of the coin as well as the wider market, crypto futures has collected a huge amount of liquidations today. In the last 24 hours, liquidations have amounted to more than $322 million, $175 million of which occurred in the past 4 hours alone.
Featured image from Unsplash.com, charts from TradingView.com, CryptoQuant.com
Bitcoin (BTC) bulls are betting on a solid month for BTC price action, as November traditionally sees strong gains for United States stocks.
Data shows that November has been the best performing month for the S&P 500 since 1985.
November 2021 has stiff competition
With “Uptober” already the biggest month in terms of gains for Bitcoin in 2021, odds are stocks could act as a catalyst for further upside in “Moonvember.”
Median S&P 500 progress in November over the past 35 years has been just over 2% — making it the only month to achieve those median returns.
At the same time, over 70% of years have seen positive returns, and Bitcoin’s history is similar.
In November, BTC/USD has ended up higher than when it started with the exception of just two years: 2018 (-36.5%) and 2019 (-17.2%).
2020 conversely saw 43% gains, leaving the door open for a rematch in line with expectations.
BTC/USD monthly returns table. Source: Bybt
As Cointelegraph reported, these predict a volatile but ultimately extremely beneficial month as Bitcoin approaches its Q4 peak.
“Highest monthly close in history. Congrats Bitcoin and congrats y’all,” an optimistic TechDev summarized on Nov. 1.
“We are now headed toward our second monthly RSI peak like every cycle before. Nowhere near a top. Trust the indicators.”
TechDev is eyeing either copycat retrace of 2017’s top sequence or that of 1970s gold, both apt to send BTC/USD far beyond $100,000.
Bitcoin’s relationship to traditional markets has come into examination in recent months as the cryptocurrency begins to carve out its own path away from macro.
Related: ‘Uptober’ closes at record high in best month of 2021 — 5 things to watch in Bitcoin this week
A test of trader resolve may come as soon as this week as the Federal Reserve prepares new comments on asset purchase tapering.
For Bitcoin, the decision whether or not to allow a regulated exchange-traded fund (ETF) in the U.S. this month may yet steer price action far away from predictions — especially if a rejection is seen.
As proponents point out slowness in following other countries, VanEck — one of over 40 applicants — has revealed it is mulling applying to launch a spot ETF in Australia.
Ether (ETH) price fell below the $3,000 support on Sept. 20 as global markets entered a risk-aversion mode. The Invesco China Technology ETF (CQQQ) closed down 4.2%, while the SPDR S&P Metals and Mining ETF (XME) lost 3.8%.
Some analysts pointed to the potential ripple effects of the default of Evergrande, a major Chinese real estate company. In contrast, others blame the ongoing debates over the debt limit in Washington as the catalyst for this week’s volatility. As a result, the CBOE Volatility Index (VIX), usually referred to as the “stock market fear index,” jumped by more than 30% to reach its highest level since May.
On Sept.19, U.S. Treasury Secretary Janet Yellen called for Congress to raise the U.S. debt ceiling again in a Wall Street Journal op-ed. Yellen suggested that avoiding this would risk causing the government to default on payments and generate a “widespread economic catastrophe.”
One of the major focuses for traditional markets is this week’s U.S. Federal Open Market Committee meeting, which ends on Sept. 22. At the meeting, the Federal Reserve is expected to signal when it will cut back its $120 billion monthly asset purchase program.
How these events impact Ether price
Ether price in USD at Bitstamp. Source: TradingView
Even though the $3,000 level sits near the bottom range of the previous performance of the past 45 days, Ether still accumulated 210% gains in 2021. The network’s adjusted total value locked (TVL) jumped from $13 billion in 2020 to $60 billion and the decentralized finance (DeFi), gaming, and nonfungible token (NFT) sectors experienced an impressive surge while Ethereum maintained dominance of the sector’s market share.
Despite mean gas fees surpassing $20 in September, Ethereum has kept roughly 60% of the decentralized exchange (DEX) volume. Its largest competitor, Binance Smart Chain, held an average daily volume slightly below $1 billion, albeit having a transaction fee below $0.40.
Ether futures data shows pro traders are still bullish
Ether’s quarterly futures are the preferred instruments of whales and arbitrage desks due to their settlement date and the price difference from spot markets. However, the contract’s biggest advantage is the lack of a fluctuating funding rate.
These fixed-month contracts usually trade at a slight premium to spot markets, indicating that sellers request more money to withhold settlement longer. Therefore, futures should trade at a 5% to 15% annualized premium in healthy markets. This situation is technically defined as “contango” and is not exclusive to crypto markets.
ETH futures 3-month annualized premium. Source: Laevitas
As displayed above, Ether’s futures contracts premium spiked to 15% on Sept. 6 as ETH price tested the $4,000 resistance. Apart from that brief overshot, the basis indicator ranged from 8% to 12% over the past month, considered healthy and bullish.
The crash to sub-$3,000 in the early hours of Sept. 21 was not enough to scare seasoned traders. More importantly, U.S. Securities and Exchange Commission chairman Gary Gensler’s interview on cryptocurrency regulation also had no noticeable impact on Ether price. Had there been a generalized fear, Ether futures premium would have reflected this.
The views and opinions expressed here are solely those of the author and do not necessarily reflect the views of Cointelegraph. Every investment and trading move involves risk. You should conduct your own research when making a decision.
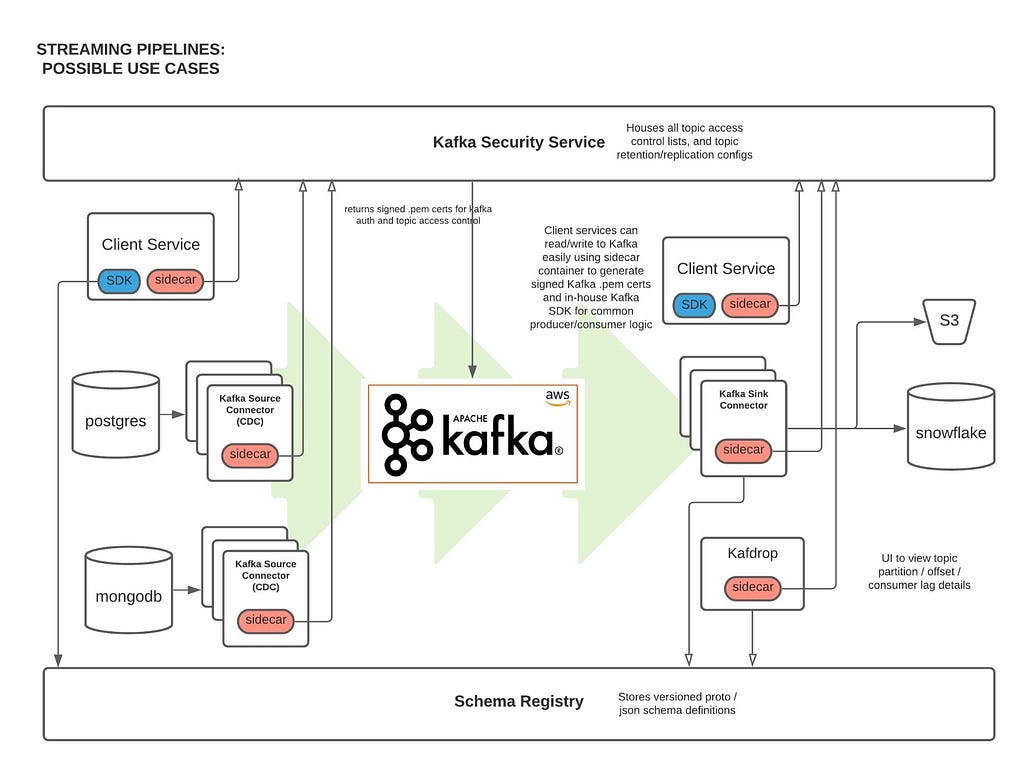
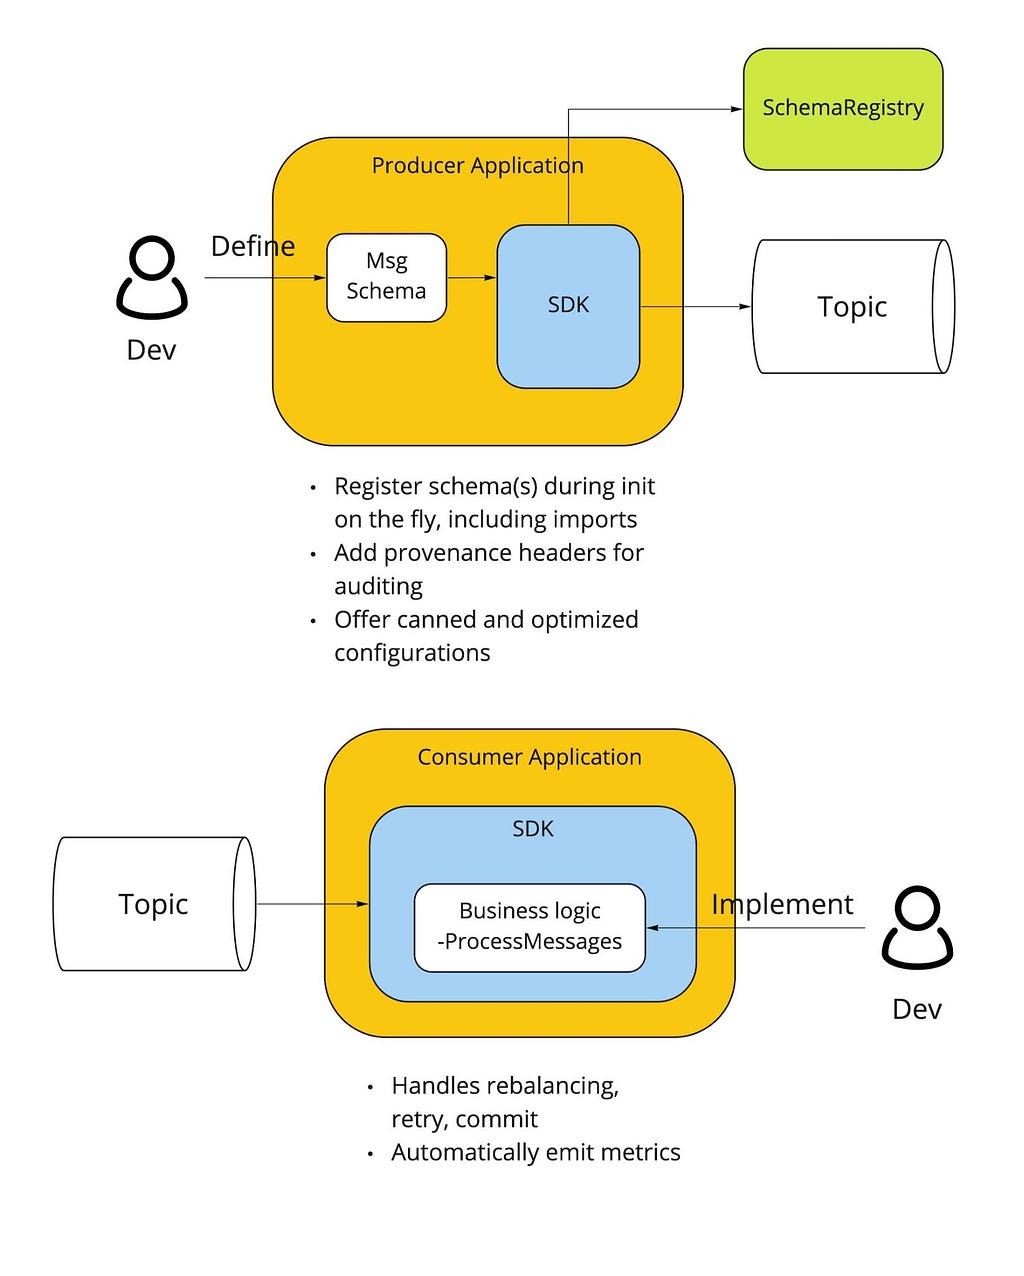
Tl;dr: Coinbase is leveraging AWS’ Managed Streaming for Kafka (MSK) for ultra low latency, seamless service-to-service communication, data ETLs, and database Change Data Capture (CDC). Engineers from our Data Platform team will further present this work at AWS’ November 2021 Re:Invent conference.
Abstract
At Coinbase, we ingest billions of events daily from user, application, and crypto sources across our products. Clickstream data is collected via web and mobile clients and ingested into Kafka using a home-grown Ruby and Golang SDK. In addition, Change Data Capture (CDC) streams from a variety of databases are powered via Kafka Connect. One major consumer of these Kafka messages is our data ETL pipeline, which transmits data to our data warehouse (Snowflake) for further analysis by our Data Science and Data Analyst teams. Moreover, internal services across the company (like our Prime Brokerage and real time Inventory Drift products) rely on our Kafka cluster for running mission-critical, low-latency (sub 10 msec) applications.
With AWS-managed Kafka (MSK), our team has mitigated the day-to-day Kafka operational overhead of broker maintenance and recovery, allowing us to concentrate our engineering time on core business demands. We have found scaling up/out Kafka clusters and upgrading brokers to the latest Kafka version simple and safe with MSK. This post outlines our core architecture and the complete tooling ecosystem we’ve developed around MSK.
Configuration and Benefits of MSK
Config:
TLS authenticated cluster
30 broker nodes across multiple AZs to protect against full AZ outage
Multi-cluster support
~17TB storage/broker
99.9% monthly uptime SLA from AWS
Benefits:
Since MSK is AWS managed, one of the biggest benefits is that we’re able to avoid having internal engineers actively maintain ZooKeeper / broker nodes. This has saved us 100+ hours of engineering work as AWS handles all broker security patch updates, node recovery, and Kafka version upgrades in a seamless manner. All broker updates are done in a rolling fashion (one broker node is updated at a time), so no user read/write operations are impacted.
Moreover, MSK offers flexible networking configurations. Our cluster has tight security group ingress rules around which services can communicate directly with ZooKeeper or MSK broker node ports. Integration with Terraform allows for seamless broker addition, disk space increases, configuration updates to our cluster without any downtime.
Finally, AWS has offered excellent MSK Enterprise support, meeting with us on several occasions to answer thorny networking and cluster auth questions.
Performance:
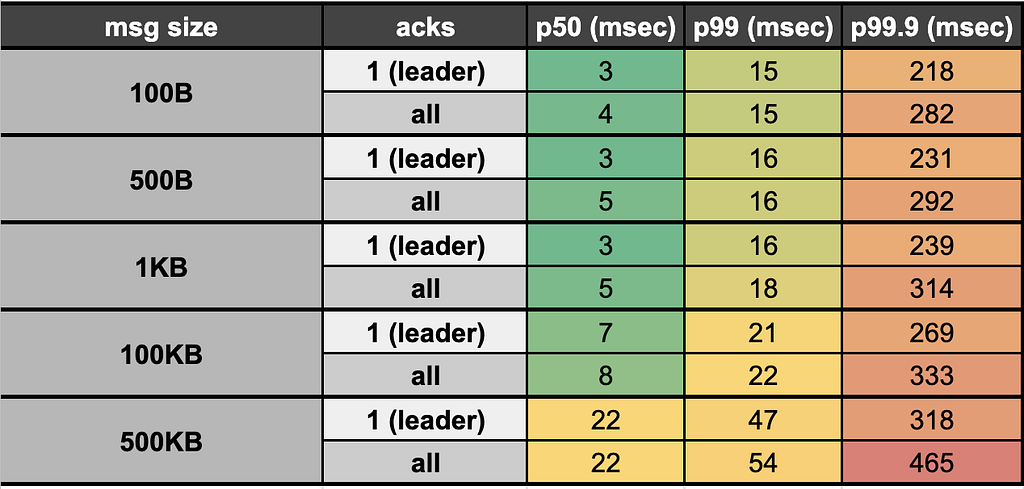
We reduced our end-to-end (e2e) latency (time taken to produce, store, and consume an event) by ~95% when switching from Kinesis (~200 msec e2e latency) to Kafka (<10msec e2e latency). Our Kafka stack’s p50 e2e latency for payloads up to 100KB averages <10 msec (in-line with LinkedIn as a benchmark, the company originally behind Kafka). This opens doors for ultra low latency applications like our Prime Brokerage service. Full latency breakdown from stress tests on our prod cluster, by payload size, presented below:
Proprietary Kafka Security Service (KSS)
What is it?
Our Kafka Security Service (KSS) houses all topic Access Control Lists (ACLs). On deploy, it automatically syncs all topic read/write ACL changes with MSK’s ZooKeeper nodes; effectively, this is how we’re able to control read/write access to individual Kafka topics at the service level.
KSS also signs Certificate Signing Requests (CSRs) using the AWS ACM API. To do this, we leverage our internal Service-to-Service authentication (S2S) framework, which gives us a trustworthy service_id from the client; We then use that service_id and add it as the Distinguished Name in the signed certificate we return to the user.
With a signed certificate, having the Distinguished Name matching one’s service_id, MSK can easily detect via TLS auth whether a given service should be allowed to read/write from a particular topic. If the service is not allowed (according to our acl.yml file and ACLs set in ZooKeeper) to perform a given action, an error will occur on the client side and no Kafka read/write operations will occur.
Also Required
Parallel to KSS, we built a custom Kafka sidecar Docker container that: 1) Plugs simply into one’s existing docker-compose file 2) Auto-generates CSRs on bootup and calls KSS to get signed certs, and 3) Stores credentials in a Docker shared volume on user’s service, which can be used when instantiating a Kafka producer / consumer client so TLS auth can occur.
Rich Data Stream Tooling
We’ve extended our core Kafka cluster with the following powerful tools:
Kafka Connect
This is a distributed cluster of EC2 nodes (AWS autoscaling group) that performs Change Data Capture (CDC) on a variety of database systems. Currently, we’re leveraging the MongoDB, Snowflake, S3, and Postgres source/sink connectors. Many other connectors are available open-source through Confluent here
Kafdrop
We’re leveraging the open-source Kafdrop product for first-class topic/partition offset monitoring and inspecting user consumer lags: source code here
Cruise Control
This is another open-source project, which provides automatic partition rebalancing to keep our cluster load / disk space even across all broker nodes: source code here
ConfluentSchema Registry
We use Confluent’s open-source Schema Registry to store versioned proto definitions (widely used along Coinbase gRPC): source code here
Internal Kafka SDK
Critical to our streaming stack is a custom Golang Kafka SDK developed internally, based on the segmentio/kafka release. The internal SDK is integrated with our Schema Registry so that proto definitions are automatically registered / updated on producer writes. Moreover, the SDK gives users the following benefits out of the box:
Consumer can automatically deserialize based on magic byte and matching SR record
Message provenance headers (such as service_id, event_time, event_type) which help conduct end-to-end audits of event stream completeness and latency metrics
These headers also accelerate message filtering and routing by avoiding the penalty of deserializing the entire payload
Streaming SDK
Beyond Kafka, we may still need to make use of other streaming solutions, including Kinesis, SNS, and SQS. We introduced a unified Streaming-SDK to address the following requirements:
Delivering a single event to multiple destinations, often described as ‘fanout’ or ‘mirroring’. For instance, sending the same message simultaneously to a Kafka topic and an SQS queue
Receiving messages from one Kafka topic, emitting new messages to another topic or even a Kinesis stream as the result of data processing
Supporting dynamic message routing, for example, messages can failover across multiple Kafka clusters or AWS regions
Offering optimized configurations for each streaming platform to minimize human mistakes, maximize throughput and performance, and alert users of misconfigurations
Upcoming
On the horizon is integration with our Delta Lake which will fuel more performant, timely data ETLs for our data analyst and data science teams. Beyond that, we have the capacity to 3x the number of broker nodes in our prod cluster (30 -> 90 nodes) as internal demand increases — that is a soft limit which can be increased via an AWS support ticket.
Takeaways
Overall, we’ve been quite pleased with AWS MSK. The automatic broker recovery during security patches, maintenance, and Kafka version upgrades along with the advanced broker / topic level monitoring metrics around disk space usage / broker CPU, have saved us hundreds of hours provisioning and maintaining broker and ZooKeeper nodes on our own. Integration with Terraform has made initial cluster configuration, deployment, and configuration updates relatively painless (use 3AZs for your cluster to make it more resilient and prevent impact from a full-AZ outage).
Performance has exceeded expectations, with sub 10msec latencies opening doors for ultra high-speed applications. Uptime of the cluster has been sound, surpassing the 99.9% SLA given by AWS. Moreover, when any security patches take place, it’s always done in a rolling broker fashion, so no read/write operations are impacted (set default topic replication factor to 3, so that min in-sync replicas is 2 even with node failure).
We’ve found building on top of MSK highly extensible having integrated Kafka Connect, Confluent Schema Registry, Kafdrop, Cruise Control, and more without issue. Ultimately, MSK has been beneficial for both our engineers maintaining the system (less overhead maintaining nodes) and unlocking our internal users and services with the power of ultra-low latency data streaming.
If you’re excited about designing and building highly-scalable data platform systems or working with cutting-edge blockchain data sets (data science, data analytics, ML), come join us on our mission building the world’s open financial system: careers page.
How we scaled data streaming at Coinbase using AWS MSK was originally published in The Coinbase Blog on Medium, where people are continuing the conversation by highlighting and responding to this story.
It’s unquestionable that the future of mankind is one filled with machines, IoT devices, and robots. Be it sensors, drones, assistant robots, they’ll all be generating abundant amounts of data through their activities and interactions with humans. Much of their generated data will be valuable to both individuals and companies.
Just take a few moments to imagine a future for yourself where you’d be able to monetize valuable data created by your robotic devices and turn that into a source of income by tokenizing it on the blockchain. Or one where your automated home environment can autonomously purchase or process helpful data to do its job better and make your life more convenient.
A collaboration between Robonomics, a platform for developers and engineers to connect IoT and ROS compatible devices to a digital economy and Ocean Protocol, which lets one monetize any kind of data is creating a future where machine data can be automatically monetized.
Through the use of Robonomics, IoT devices and robots can become economic agents for people. Simply put, they can partake in legal obligations, purchase things, and even participate in an open job market.
As mentioned previously, a robot economy naturally produces a lot of data, this is where Ocean comes in. Robonomics leverages Ocean Protocol and the creation of data tokens, a fundamentally new type of asset, to discover new pathways and use cases for automatically monetizing data generated by robots and IoT devices.
With a growing robotics and automation trend in everyday life, it is now already possible to quite easily see potential applications of such technology. An important and demanded one is the tokenization of environmental data obtained from a device, for example, a sensor or drone that measures soil, air, and water pollution.
The ability to tokenize and monetize such environmental data will allow for the emergence of new markets that revolve around concepts of carbon credits and citizen science. If we take into account a growing interest in pollution, environmental friendliness and management, then quite a bit of value can be attributed to this data. And the value of it will only continue to grow.
We all interact with autonomous systems quite frequently in our daily lives while often paying no attention to it. For instance, we’ve all likely been in contact with a robotic customer service agent on the phone or online. There is valuable data in such interactions that could be tokenized for marketing and consumer relations purposes.
As the trend of IoT and robotics involvement in our daily lives continues to grow, so will use cases for the tokenization of such data. Imagine robot waiters or public service workers and the audio, visual, and any other data they collect when executing any given task like serving or helping a customer. If such a robotic waiter or worker was live on the Robonomics network, its data could be collected and further analyzed with machine learning and various algorithms, tokenized, and sold to those who need it.
The use cases presented are no more than but a little food for thought of what can be achieved through the Robonomics Network and Ocean Protocol collaboration. As IoT and robots continue to proliferate, entirely new avenues for the use of their data will emerge. And both projects are essentially ushering in a new market for cyber-physical data and will be at the forefront of it.