Lolli, a bitcoin (BTC) shopping rewards app, announced today the close of a $10 million Series A financing round led by early Chime backer, Acrew Capital.
The round also included Banana Capital, Up North Management, and Animal Capital, the Gen. Z-focused venture capital fund founded by social media stars Josh Richards, Griffin Johnson, and Noah Beck.
Plus, this Series A funding round saw investments from influencers and entrepreneurs such as Logan Paul, Chantel Jeffries, Lauren Riihimaki of LaurDIY, Kenny Beecham, and Baron Davis.
Additionally, the raise includes a recommitment from many of Lolli’s early investors, including Alexis Ohanian’s Seven Seven Six, 3K VC, Gabriel Leydon, and Forerunner Ventures.
This new funding will aid in expanded hiring, new partnerships, and further development of Lolli’s newly launched mobile app.
Founded in 2018 by Matt Senter and Alex Adelman, Lolli gives users BTC rewards on everyday purchases.
Shoppers can use Lolli’s mobile app or browser extension to earn bitcoin rewards at more than 1,000 top retailers and Fortune 500 companies including Kroger, Microsoft, and Booking.com.
To date, Lolli users have earned more than $3.5 million in bitcoin rewards.
Bitcoin price started a strong upward move above the $35,000 resistance against the US Dollar. BTC is showing positive signs and it could rally further above $40,000.
Bitcoin started a strong increase above the $33,000 and $35,000 resistance levels.
The price is now trading well above $35,000 and the 100 hourly simple moving average.
There is a key bullish trend line forming with support near $35,500 with resistance near $31,250 on the hourly chart of the BTC/USD pair (data feed from Kraken).
The pair could correct gains, but the bulls are likely to remain active near $37,000.
Bitcoin Price Surges above $38,000
Bitcoin price found a strong buying interest near the $32,000 zone. BTC formed a support base near the $32,000 and it started a major upward move.
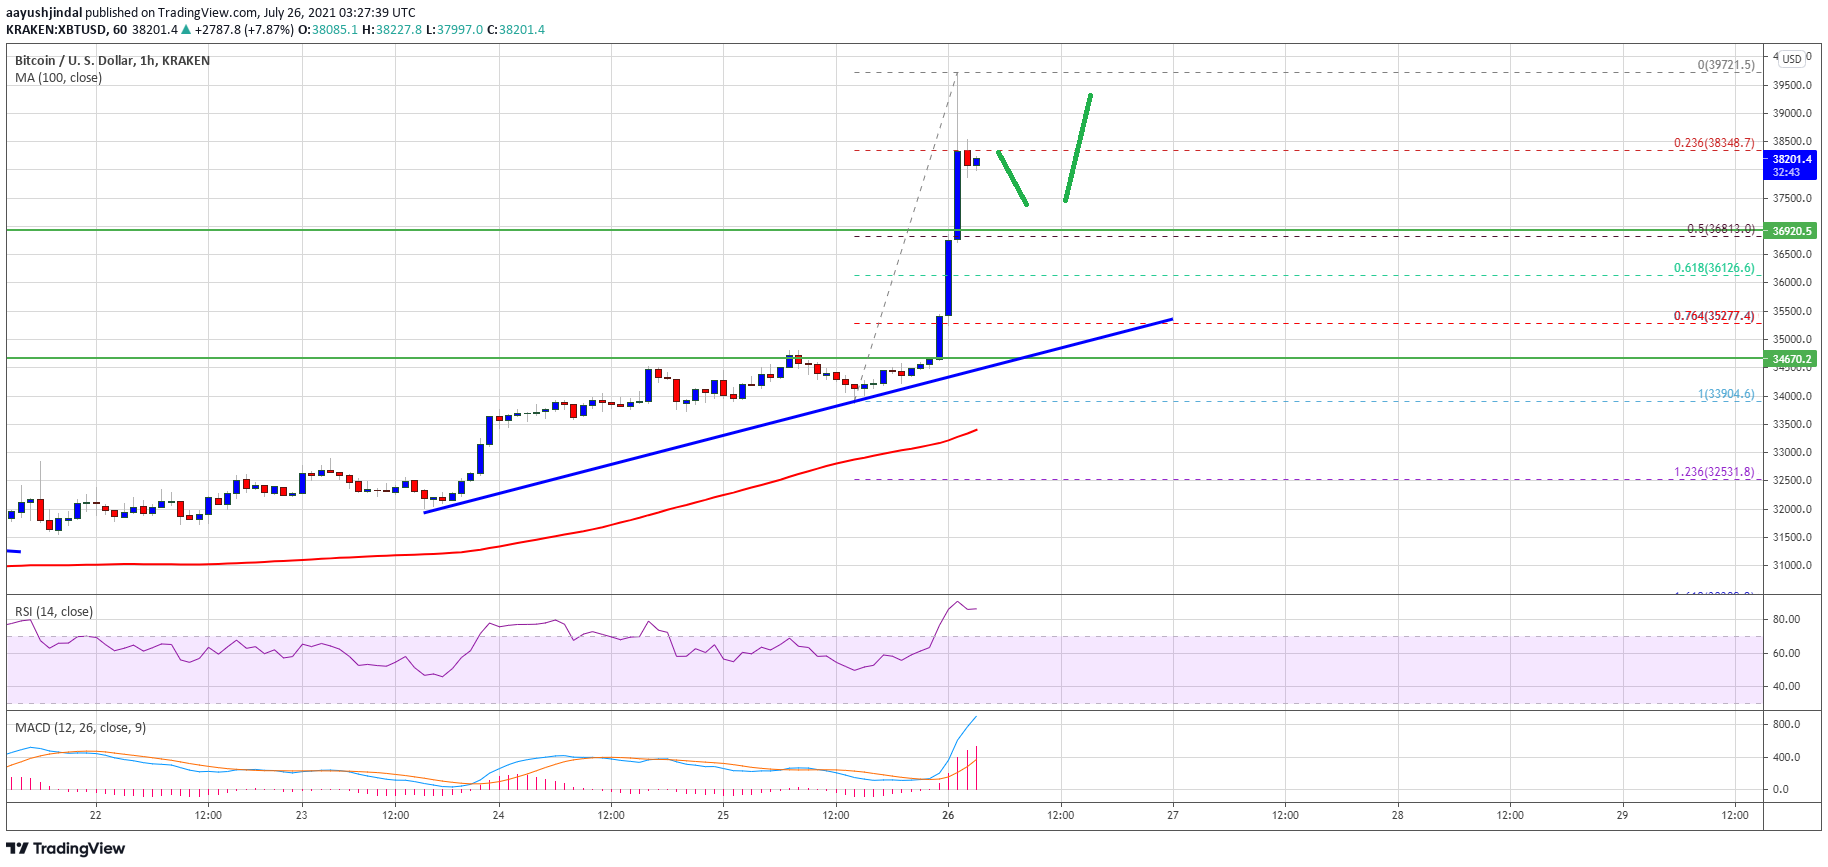
The price surged above the $32,000 and $35,500 resistance levels. There was a clear break above the $38,000 resistance level. The upward move gained strength and the price even traded close to the $40,000 resistance zone.
A high was formed near $39,721 and the price is now correcting gains. It is trading near the 23.6% Fib retracement level of the recent rally from the $33,904 swing low to $39,723 high. Bitcoin is now trading well above $35,000 and the 100 hourly simple moving average.
There is also a key bullish trend line forming with support near $35,500 with resistance near $31,250 on the hourly chart of the BTC/USD pair. It is showing a lot of positive signs near the $38,000 level. On the upside, an initial resistance is near the $39,000 level.
Source: BTCUSD on TradingView.com
The first major resistance is near the $39,500 level. The main resistance sits near $40,000. A successful break and close above the $40,000 level could initiate a fresh rally in the near term. In the stated case, the price is likely to move towards the $42,500 level in the near term.
Dip Supported in BTC?
If bitcoin fails to climb above the $39,500 and $40,000 resistance levels, it could start a downside correction. An initial support on the downside is near the $37,500 level.
The first major support is now near the $36,800 zone. A clear downside break below the $36,800 support may possibly push the price towards the $36,000 support zone in the near term.
Technical indicators:
Hourly MACD – The MACD is now losing pace in the bullish zone.
Hourly RSI (Relative Strength Index) – The RSI for BTC/USD is now well in the overbought zone.
Major Support Levels – $37,500, followed by $36,800.
Major Resistance Levels – $39,000, $39,500 and $40,000.
Bitcoin price extended its decline below the $31,200 support against the US Dollar. BTC remains at a risk of a larger decline below the $30,000 support zone.
Bitcoin remains in a bearish zone and it even broke the $31,000 support zone.
The price is now trading well below $32,000 and the 100 hourly simple moving average.
There is a major bearish trend line forming with resistance near $31,550 on the hourly chart of the BTC/USD pair (data feed from Kraken).
The pair is likely to accelerate lower below the $30,500 and $30,000 levels in the near term.
Bitcoin Price Extends Losses
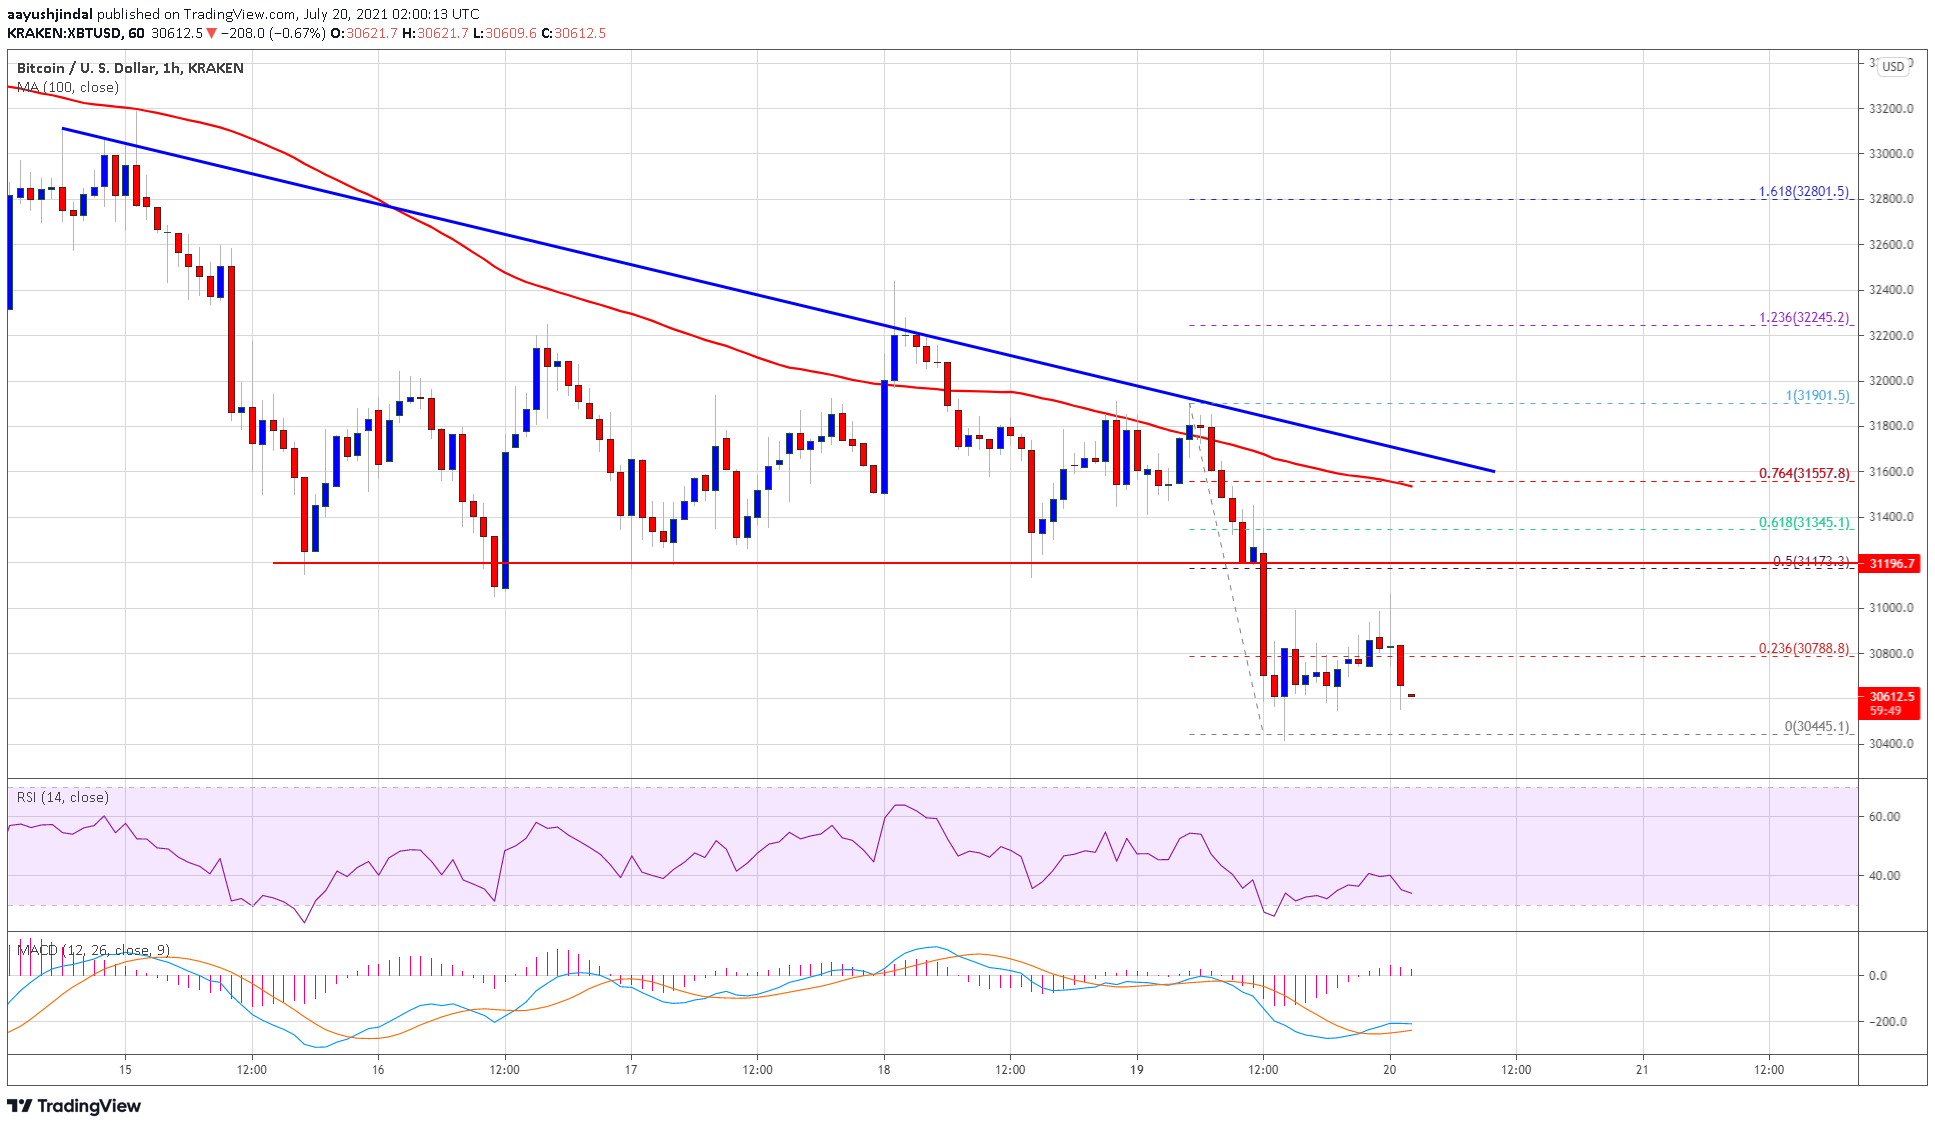
Bitcoin price remains in a downtrend and it is now trading well below the $33,000 pivot zone. BTC extended its decline below the $31,200 support zone and it settled well below the 100 hourly simple moving average.
The price extended its decline and it even traded below $30,650. A low is formed near $30,445 and the price is now consolidating losses. It corrected a few points above the $30,500 level. However, there was no proper follow through above the 23.6% Fib retracement level of the recent drop from the $31,901 swing high to $30,445 low.
An immediate resistance on the upside is near the $31,200 level (the recent breakdown zone). It is near the 50% Fib retracement level of the recent drop from the $31,901 swing high to $30,445 low.
The next key resistance is near the $31,500 level. There is also a major bearish trend line forming with resistance near $31,550 on the hourly chart of the BTC/USD pair. The trend line resistance at $31,500 is also close to the 100 hourly SMA.
Source: BTCUSD on TradingView.com
A close above the trend line resistance could initiate a decent recovery above $32,000. Besides, a proper break above the $32,000 level may push the price towards $33,000.
More Losses in BTC?
If bitcoin fails to recover above the $31,200 and $31,500 resistance levels, there is a risk of more losses. An initial support on the downside is near the $30,500 level.
The first major support is now near the $30,200 zone. The main support is now near the $30,000 level. A close below the $30,000 level could spark a steady decline in the near term.
Technical indicators:
Hourly MACD – The MACD is slowly gaining pace in the bearish zone.
Hourly RSI (Relative Strength Index) – The RSI for BTC/USD is now well below the 50 level.
Major Support Levels – $30,500, followed by $30,000.
Major Resistance Levels – $31,200, $31,500 and $32,000.
In the last 29 days, Bitcoin (BTC) has been ranging from $31,000 to $36,000 as the impact of the recent China ban and a $1.4 billion Grayscale GBTC share unlocking continue to pressure markets.
China’s government implemented a series of measures to curb cryptocurrency mining and trading by ordering the immediate shut down of some operations and instructing domestic banks to suspend the bank accounts of entities involved in the industry.
Meanwhile, the $21 billion trust fund Grayscale and its GBTC security is facing a troublesome period as institutional investors’ 6-month lock up comes to an end, creating a potential $1.4 billion sell-off. However, it’s worth noting that the 654,000 BTC tokens under management will not be moved on the market.
As a result of these factors, Bitcoin price has been stuck in a range for months and generally traders appear to be sitting on their hands until clarity on the entire situation clears up.
While traders are skilled at using perpetual futures contracts, most are unaware of additional instruments that can be used to maximize their gains. This holds especially true when markets range sideways and creates a perfect scenario for trading options.
For example, one can build an options strategy that maximizes gains even when there is not much price action.
By using both call (buy) and put (sell) options, a trader can create strategies to generate gains in sideways markets. These can be used in bullish and bearish circumstances, and most derivatives exchanges offer accessible options platforms.
The Iron Condor strategy favors a tight range
The Iron Condor is a neutral strategy that consists of selling a $32,000 put to create positive exposure to Bitcoin while simultaneously selling a $34,000 call to reduce gains above that level. These trades were modelled from Bitcoin price at $31,750 and this trade uses an Aug. 27 expiry (40 days).
Profit / Loss estimate. Source: Deribit Position Builder
Two out-of-the-money (small odds) positions are needed to protect from the possible price crashes below $28,000 or Bitcoin appreciation above $38,000. These additional trades will give the trader peace of mind while also reducing the margin (collateral) requirements.
Any outcome on Aug. 27 between $29,200 (down 8%) and $36,660 (up 15%) yields a positive result. The maximum gain happens between $31,800 and $34,200, resulting in a 0.09 Bitcoin profit. On the other hand, the worst outcome is a 0.045 Bitcoin loss.
A similar structure could be deployed for Ethereum (ETH) options but traders should account for the London hard fork on Aug. 4, which could potentially induce sharper volatility.
The views and opinions expressed here are solely those of the author and do not necessarily reflect the views of Cointelegraph.com. Every investment and trading move involves risk, you should conduct your own research when making a decision.
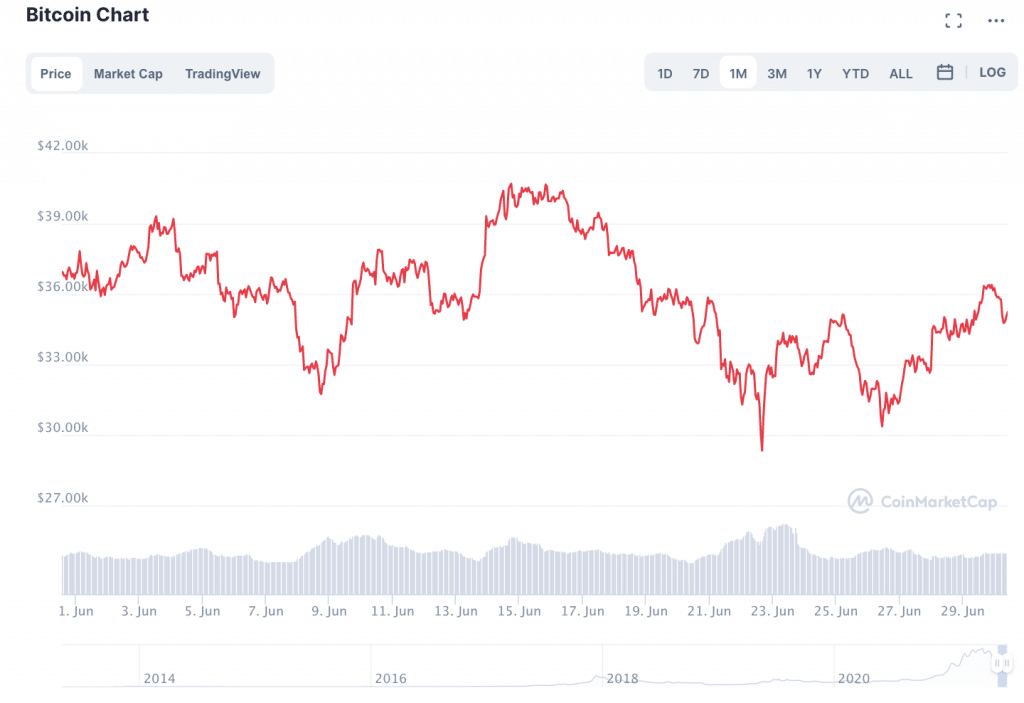
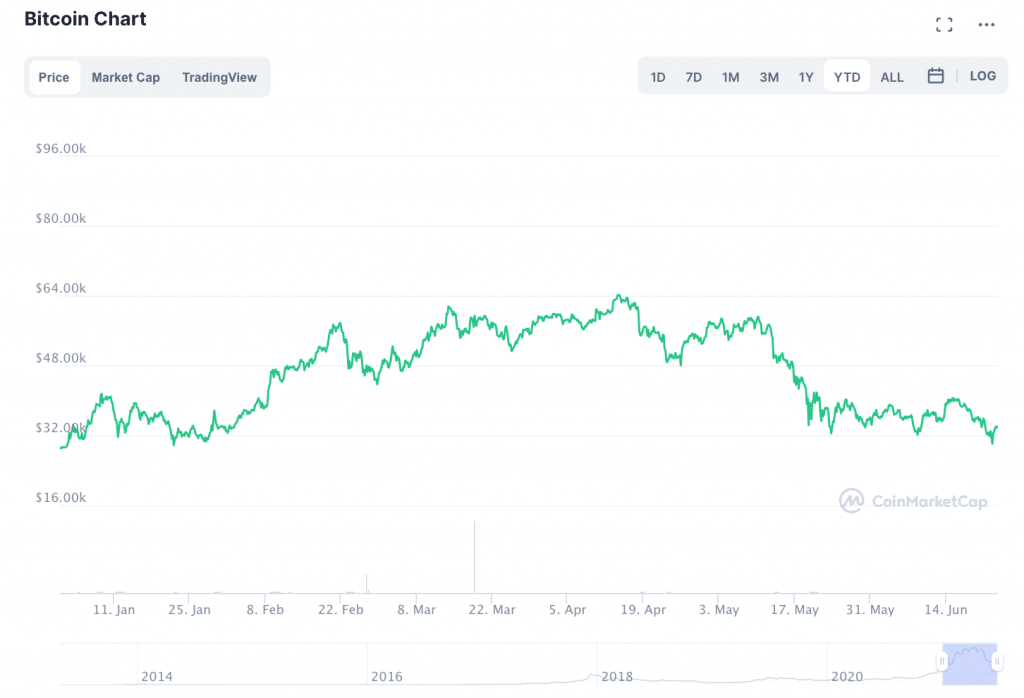
At times, Bitcoin looks as though it may be moving towards recapturing the $40K support line. But then, only a few hours later, Bitcoin seems to take a turn in the opposite direction. Still, the price of BTC seems to have developed some fairly resilient support around the $30K line. The only time Bitcoin managed to dip below $30K over the past few weeks, and then it quickly snapped back up.
Since that point, Bitcoin continued along the same meandering trajectory, wandering around $32K-$34K, occasionally visiting the neighbourhood of $35K-$39K. In comparison to the astronomical journey of swells and dips that Bitcoin went on earlier this year, it seems as though Bitcoin is taking it easy.
Bank Account Alternative. Business Account IBAN.
Mixed Messages from Bitcoin
So, the big question is all about what is going to come next. Will BTC crash through $30K after all? Will it surge past $40K, $50K and reach new heights above $60K? What gives?
(The answer, of course, depends on who you ask.)
Cointelegraph reported this morning that the number of active addresses on the Bitcoin network fell sharply over the course of the past several weeks, from 1.3 million to approximately 500,000, roughly 60%. The drop caused the number of active wallets on Ethereum to take the lead over Bitcoin for the third time in a month. Before this, the last time that the Ethereum network had more active wallet addresses than Bitcoin was in early 2017.
A Twitter analyst known as ‘Mr Whale’ pointed out that based on a weekly moving average, active addresses on the Bitcoin network have fallen to their lowest point since April of 2020, a point at which many analysts tie to BTC’s run to $60K earlier this year.
“Bitcoin’s active addresses on the blockchain network just plunged to its lowest level since April 2020,” Mr Whale wrote on Twitter. “This data is bearish. It shows demand for Bitcoin is drying up very quickly.”
Bitcoin’s active addresses on the blockchain network just plunged to its lowest level since April 2020.
The dip in the number of active Bitcoin addresses could indicate several things. However, it is likely that this change has much to do with the exodus or dormancy of retail investors who entered the market for the first time during BTC’s big rally throughout 2020 and earlier in 2021. If these retail investors fail to actively re-enter the market, it is unclear what the long-term consequences could be.
“Bitcoin Is like a Spring. We Stretch It Too Much and We Put Too Much Leverage.”
Some analysts do not seem to be too concerned about the dip in active wallet activity. Alex Mashinsky, Chief Executive of Celsius and renowned crypto commentator, told CoinTelegraph at the Miami Bitcoin 2021 conference in June that he sees Bitcoin reaching as high as $160,000 this year. “We haven’t seen the highs yet for 2021,” he said.
Mashinsky believes that the Bitcoin market correction that took place in May was just another step along the path to new heights.
Suggested articles
GIBXChange is About to Start the Warm-Up of the MT5 FX System!Go to article >>
Alex Mashinsky, Founder and CEO of Celsius.
“When you go too high, too fast, you are bound for a correction,” he said, adding that “You can see my tweets in both March and February saying ‘we’re going to have a crash, we’re going to have a correction.’ I predicted $30,000.”
Mashinsky cited over-leveraged markets as the reason for Bitcoin’s volatility earlier in the year: “Bitcoin is like a spring,” he said. “We stretch it too much, and we put too much leverage. Too many people got greedy.”
Rebuilding without Leverage?
Indeed, a number of analysts agree that leverage seems to have been the primary cause behind Bitcoin’s volatility earlier this year.
Shortly after the crash in May, CNBC reported that: “Traders taking excessive risk in unregulated cryptocurrency markets” were forced to sell when prices started to drop. Therefore, what may have been a minor correction in the price of Bitcoin spiralled into a price drop of roughly 30 percent.
Leverage is not unique to Bitcoin. It can be practised across capital markets. However, the difference between leverage in Bitcoin and leverage in traditional markets is the fact that it is so unregulated. Some cryptocurrency exchanges allow their customers to take extreme risks. For example, BitMEX allows any one of its users, no matter their level of trading experience, as much as 100-to-1 leverage for cryptocurrency trades.
When Bitcoin crashed in May, $12 billion was liquidated across 800,000 leveraged Bitcoin positions. Therefore, rebuilding the price of Bitcoin in a sustainable way cannot include high amounts of leverage, lest history repeats itself.
A More Balanced Future for BTC?
Now that leverage has been rinsed from the markets, Bitcoin may indeed have an opportunity to rebuild in a healthier way.
There is some evidence to show that this growth could come from the developing world.
#Bitcoin has a market cap of $680 billion dollars.
If 1% of it is invested in El Salvador, that would increase our GDP by 25%.
On the other side, #Bitcoin will have 10 million potential new users and the fastest growing way to transfer 6 billion dollars a year in remittances.
In June, El Salvador’s President, Nayib Bukele, said in a national address that bitcoin will officially become legal tender in the country on September 7th. A second bill proposed in Paraguay would make the country the second to embrace Bitcoin as legal tender. Moreover, the American University of Paraguay announced that it will accept bitcoin tuition payments.
Additionally, Tanzanian President Suluhu Hassan told the nation’s financial chiefs to prepare for cryptocurrency: “We have witnessed the emergence of a new journey through the internet,” she declared. “I know that throughout the nation, including Tanzania, they have not accepted or started using these routes. However, my call to the Central Bank is that you should start working on that development.”
As the month of June draws to a close, Bitcoin is continuing to trade within the $30K – $40K range for the fourth week in a row.
Justin Hartzman, Chief Executive of Canadian cryptocurrency trading platform, CoinSmart.
Bank Account Alternative. Business Account IBAN.
Justin Hartzman, Chief Executive of Canadian cryptocurrency trading platform, CoinSmart, told Finance Magnates that: “It’s no secret that the crypto market has more or less been moving along sluggishly.”
Indeed, BTC still does not seem to have enough momentum to make strong moves one way or the other. While BTC briefly dropped below $30K earlier this month, a move that many feared would lead to further drops, it quickly recovered to levels just over $30K.
“During this recent surge, the Bitcoin price managed to flip the 20-day simple moving average from resistance to support,” Hartzman explained. “This is crucial as the bulls have gained a strong support wall which could prevent a further fall.”
On the other hand, BTC does not seem to have enough support to break through the other side of the $30K – $30K range, either. “The Bitcoin price faces a major resistance wall between $36,500 – $38,500.”
Was Bitcoin Oversold in May?
According to IntoTheBlock’s IOMAP metric, “around 1.65 million addresses had purchased ~850,000 BTC tokens at this level,” Hartzman explained. IOMAP, which stands for “Out of the Money Around Current Price,” identifies the ten most relevant clusters of investor positions at a range of +-15% of Bitcoin’s price at any given moment.
Doug Schwenk, Chairman and Chief Executive of Digital Assets Research (DAR).
“It’s likely true that BTC’s price was overly-impacted by some negative news events in the past weeks.”
“If the buyers somehow flip this wall from resistance to support, $40,000 is definitely within reach,” he continued. “It depends on the appetite for long-term investors in further accumulation of BTC during this market phase.”
Doug Schwenk, Chairman of Digital Asset Research (DAR), added that Bitcoin’s price movement has “been very positive over the past couple of days, and could continue upward.”
“BTC trades largely on sentiment, and if that continues to be positive in the coming hours and days, we could easily see BTC trade above $40k. It’s likely true that BTC’s price was overly-impacted by some negative news events in the past weeks which has seen it trade lower than anticipated.” Indeed, the government of China has been cracking down on cryptocurrency mining, leading to some uncertainty in Bitcoin markets. However, some analysts believe that this crackdown will not hinder BTC’s growth in the long term.
Banning Bitcoin mining makes the network more resilient.
Future generations will look at this time and it’ll be obvious that a decentralised monetary network at scale is more resilient than a nation state acting against it. https://t.co/8pTe4snjpZ
Exchanging Gift Cards to Crypto, Bitcoin’s Adoption Going MainstreamGo to article >>
Of course, “It’s always at risk of falling further, especially as an asset that trades on sentiment and doesn’t yet have a strong economic use case.” However, BTC’s recent sell-off “has been perceived as over done, which likely brings buyers back into the market. Only time will tell if that view will turn into action.”
Leverage Has Been Purged from Bitcoin, Possibly Promoting Healthier BTC Growth
This prolonged period of relative stagnancy in the price of Bitcoin seems to reflect the possibility that much of the leverage that propped the Bitcoin price up earlier this year has been purged from the market.
Indeed, the elimination of leverage from Bitcoin was cited as the reason for BTC’s price crash in May. Over the course of the month, the price of BTC dropped from $58,000 to $34,000; at its lowest point, the price of Bitcoin was nearly $32K.
Tom Howard, Head of Business Development & Growth at PowerTrade, told Finance Magnates that: “Funding rates appear to have stabilized near zero or slightly negative, which indicates the overexposed bulls have rinsed out and bears are being cautious.”
“Realized volatility has fallen, indicating that over-leveraged positions have been closed out, and that market strength is building.”
Tom Howard, Head of Business Development & Growth at PowerTrade.
Indeed, while leverage seems to have been the driving force that drove the price of Bitcoin to unprecedented heights earlier this year, the market structure was practically wiped away in an instant. A Bitcoin that is overly pumped by leverage has a house built on the sand. Now that leverage has been expelled, BTC may have a shot at building its house on the rock.
In the Short-Term, “De-Levered Markets Get Crushed”
American entrepreneur-turned-crypto enthusiast, Mark Cuban Tweeted about the effects of leveraged trading in the midst of the price drop: “De-Levered Markets get crushed,” he said.
“Doesn’t matter what the asset is. Stocks. Crypto. Debt. Houses. They bring forced liquidations and lower prices. But, crypto has the same problem that HFTs (high-frequency traders) bring to stocks, front-running is legal, as gas fees introduce latency that can be gamed That makes drops drop faster, and gains go up faster,” he said.
While the price drop seemed to foster negative opinions about Bitcoin related to short term price volatility, some analysts believe that the expulsion of leverage from the market is a positive thing for BTC over the long term. Hartzman said that: “this is a good thing, as some semblance of normalcy can now return to the market.”
“There was way too much leverage for market dynamics to remain sustainable over the long-term.”
“Altcoins Are Seeing a Surge That’s Not Necessarily Reflected in Bitcoin Dynamics.”
While Bitcoin may be moving sluggishly, altcoins are seeing much stronger price movements. “Bitcoin is the market leader so it definitely has a major impact on the price movement of altcoins,” Hartzman told Finance Magnates.
“Even so, altcoins are seeing a surge that’s not necessarily reflected in the bitcoin dynamics. There’s been renewed interest in DeFi and many investors are taking the low volatility in BTC prices to revisit the fundamentals of other promising crypto projects.”
Additionally, Schwenk told Finance Magnates that: “We see continued interest in a rotation from BTC into so-called altcoins.”
“Some buyers have been quicker to act on that interest and some are waiting. There is a strong narrative to altcoins as an alternative on several metrics including, ESG and fundamentals. We think, based on client feedback, that this trend will continue over the next year as Ethereum transitions to proof-of-stake and changes happen in the altcoin ecosystem.”
What are your thoughts on Bitcoin’s price movements and their effects on the altcoin market? Let us know in the comments below.
Bitcoin price extended its recovery above the $36,000 zone against the US Dollar. BTC topped near $36,700 and it is now correcting gains.
Bitcoin started a fresh increase above the $35,000 and $36,000 resistance levels.
The price is now trading nicely above $35,000 and the 100 hourly simple moving average.
There is a major bullish trend line forming with support near $35,700 on the hourly chart of the BTC/USD pair (data feed from Kraken).
The pair is likely to start a downside correction below $35,700 and $35,500 in the near term.
Bitcoin Price is Correcting Gains
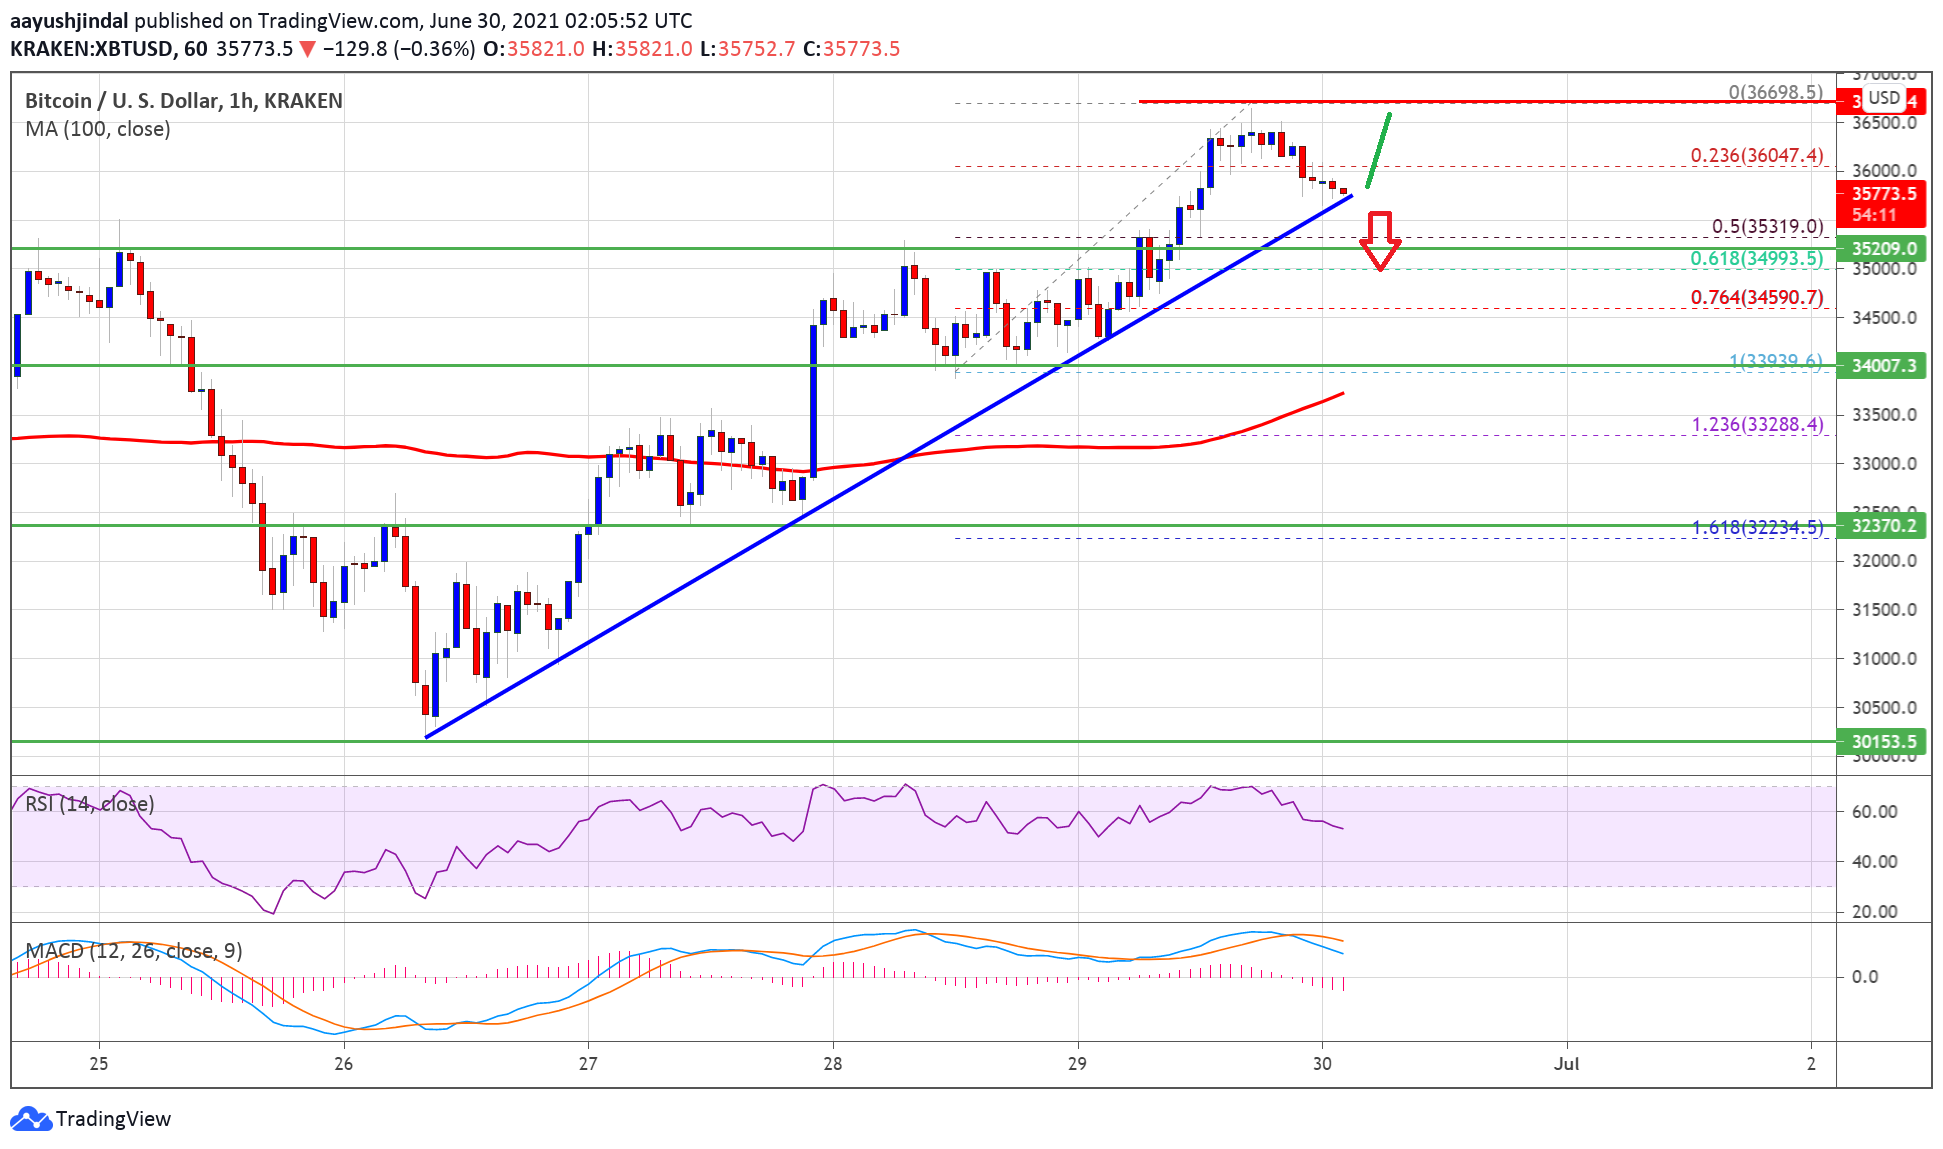
Bitcoin started a steady increase after it settle above the $34,000 level. BTC broke the key $35,000 barrier and the 100 hourly simple moving average to move further into a positive zone.
The price even spiked above the $36,500 resistance. It traded as high as $36,698 and it is now correcting gains. There was a break below the $36,500 and $36,000 levels. It even traded below the 23.6% Fib retracement level of the upward move from the $33,939 swing low to $36,698 high.
Bitcoin is still trading nicely above $35,000 and the 100 hourly simple moving average. There is also a major bullish trend line forming with support near $35,700 on the hourly chart of the BTC/USD pair.
Source: BTCUSD on TradingView.com
If the pair fails to stay above the trend line support, it could start a downside correction below $35,500. The next key support is near the $35,200 level. It is near the 50% Fib retracement level of the upward move from the $33,939 swing low to $36,698 high. Any more losses might call for an extended decline towards the $34,000 support zone in the coming sessions.
Fresh Increase in BTC?
If bitcoin remains stable above the trend line support, it could rise further above the $36,000 resistance. An immediate resistance on the upside is near the $36,500 level.
The next key resistance is near $36,700, above which the bulls are likely to aim a fresh high above $37,000. Any more gain could lift the price towards the $38,000 resistance. The next major barrier is near the $40,000 zone.
Technical indicators:
Hourly MACD – The MACD is slowly losing pace in the bullish zone.
Hourly RSI (Relative Strength Index) – The RSI for BTC/USD is still well above the 50 level.
Major Support Levels – $35,700, followed by $35,200.
Major Resistance Levels – $36,000, $36,500 and $38,000.
For the past several weeks, the price of Bitcoin has been dancing just above the $30,000 support level, sometimes dipping below and occasionally making strong moves toward the $40,000.
Bank Account Alternative. Business Account IBAN.
But, every time Bitcoin seems to make a decisive move one way or the other, it is only a matter of hours before BTC retreats to familiar territory: price levels around $31K, $33K, $35K with no clear path forward.
Bitcoin’s relative stagnancy around this level has caused a bit of division amongst analysts attempting to predict what could happen next. Some believe that BTC is just moments away from regaining its losses and riding a rally back to $60K and beyond by the end of the year. In June, some analysts have predicted that BTC could reach as high as $200,000 by the end of 2021.
However, not everyone is so optimistic. If Bitcoin falls to sustained levels below $30K, some analysts believe that BTC may be in for a prolonged depression before any upward movement is possible. Thus, Bitcoin seems to be in a rather precarious position: while BTC seems fairly stable above $30K, movement below $30K could lead Bitcoin to new lows. So what’s next for Bitcoin?
Would a Move below $30K Trigger Another Wave of Leveraged Bitcoin Liquidations?
“If Bitcoin drops below $30K for more than a few hours, it will cause a worldwide panic from traders and people searching for places to buy BTC,” said Kelan Kline to Finance Magnates. Kline is a personal finance expert and Co-Founder of The Savvy Couple.
A prolonged movement below $30K could essentially trigger a series of events that closely resemble what happened to Bitcoin markets in May of this year: “Exchanges will be under extreme pressure with too many customers on the website at once, causing market instability in both fiat and cryptocurrency markets.”
“When it’s trading time in Asia, Bitcoins liquidity could be significantly lower as traders would follow suit of selling their bitcoins off as well, which would create an even larger waterfall effect on the global financial system.”
“We Haven’t Lost All Gains in 2021.”
One point of possible positive news for Bitcoin is the fact that it actually did briefly fall below $30K earlier this week, and it did not trigger a new wave of liquidations, as some believed it would.
In fact, some analysts see the drop below $30K as a sort of non-event: Marco Van Den Heuvel, Head of Community at decentralized search engine Presearch, told Finance Magnates that: “This dip honestly did not come as a surprise.”
“Breaking $30,000 pretty much indicated we would see $28K levels, followed by hopeful support and a bounce. Which is what we saw starting just now, back to $31,500,” he explained.
In fact, Van Den Heuvel pointed out that any further drops below $30K could be a good thing for Bitcoin’s price levels in the long term. After all, the price drops may present opportunities for longer-term hodlers with ‘diamond hands’ to scoop up BTC at a discount.
Marco Van Den Heuvel, Head of Community at decentralized search engine Presearch.
“They are key levels in which a lot of buys are waiting to scoop up ‘cheap’ Bitcoin,” Van Den Heuvel said. “Personally, I believe we’re trading around support levels now for Bitcoin, whereas altcoins can still see another 30-40% decrease in price if bitcoin dominance actually attempts the 50% retest and successfully breaks it.”
Suggested articles
GIBX Mining Farm and IPFS Mining Pool Opening Up New OpportunitiesGo to article >>
“Realistically, we haven’t lost all gains in 2021,” he continued. “Bitcoin is trading around January 2021 levels, as are many altcoins. I feel like this event puts many people back into reality; making money is ‘easy, but keeping it is a different skill. It requires stone-cold decision making, rather than being permanently bullish.”
“Risk management is important. It’s also clear how much speculation there is still in this space, and how people’s emotions take over, resulting in a [downward] spiral of events.”
How deep is this downward spiral? “To me, current sentiment shows we’re hopefully close to a bottom,” he said. “Many people that capitulate now may not find their lower buy orders hit.”
BTC Sales by “Weak-Handed” Hodlers Could Give Way to Purchases by Longer-Term Investors
Indeed, under current market conditions, Bitcoin may not be poised to drop anytime soon, but negative news could bring a new round of bearish movements to BTC.
Ben Reynolds, the Founder of Sure Dividend, pointed out to Finance Magnates that Bitcoin is still reeling from negative news that hit the headlines in May: “China has recently cracked down more on crypto by banning more crypto-related social media accounts on Weibo,” he said, adding that Elon Musk’s Twitter drama may have influenced Bitcoin.
Ben Reynolds, Chief Executive of Sure Dividend.
Reynolds also pointed to “the FBI reclaiming the millions of dollars worth of bitcoin from the pipeline ransom hackers group,” which he said “[proves] that governments can still manipulate it even when it is not regulated, which could have some investors who prefer to question their investments.”
These pieces of news, and any other negative reports that could come out soon, may continue to wash out new money from bitcoin markets. “Any new investors who are susceptible to emotion and fear clouding their investment decisions might be the ones who pull out and cause BTC to drop below $30K,” Reynolds said.
On the other hand, positive news updates about Bitcoin could act as a boon for crypto prices and positive developments are underway: “Businesses are developing bitcoin ETFs, allowing customers to buy, sell and checkout by using crypto. The FBI used it to reclaim a ransom and strengthened its ability to become more mainstream.”
“Investor Fixation on Every Little Price Fluctuation Is Derailing the Ecosystem from What It’s Supposed to Be Doing.”
And while $30K seems to be Bitcoin’s ‘magic number’ of the moment, Kirobo Chief Executive, Asaf Naim pointed out that BTC analysts and investors often become fixated on certain price points.
“We all know that investors can panic when they see an asset fall below the price they consider symbolic,” Naim told Finance Magnates. “But, let’s not forget that these numbers are arbitrary – back in 2017, $20,000 was considered the magic number for Bitcoin.” In the years between 2018 and 2020, it was all about Bitcoin’s so-called “curse of $10,000.”
“Then in April of this year, it topped $63,000, and now $30,000 is considered the bottom,” Naim continued.
Asaf Naim, Chief Executive of Kirobo.
Indeed, Bitcoin’s big price rally from November of 2020 until May of 2021 reset the global mindset about where Bitcoin should be price-wise. Before the chain of liquidations that sent the price spiralling in May, some analysts and investors believed that a steady price above $50K could soon be Bitcoin’s new ‘normal’. However, BTC has failed to regain enough momentum to sustain levels above $40K for weeks.
Now that the latest round of hype seems to be over, the conversation around Bitcoin seems to be shifting away from how big BTC will be and back towards how it can and will be useful to the world.
“I think that if people would focus on the very real, practical applications of decentralized technology instead of obsessing over whatever mood Bitcoin has decided to be in on a given day, they’d find that the fundamentals of the crypto market as a whole are rock-solid,” Naim told Finance Magnates.
“Frankly, I think that investor fixation on every little price fluctuation is derailing the ecosystem from what it’s supposed to be doing – upgrading the way the world transacts through decentralized technology.”
Bitcoin’s (BTC) price continues to be range-bound between $30,000 and $40,000 level for the past few days, which is not necessarily a bearish sign.
Generally, after a sharp fall, the price tends to consolidate as the asset transfers from weaker hands to stronger hands. After the transition is complete, the asset breaks out and starts a new uptrend. Usually, the longer the price consolidates in a range, the stronger the next trending move will be.
Bloomberg Intelligence senior commodity strategist Mike McGlone said on Saturday that Bitcoin’s declining supply was a positive sign, which could act as a “bullish ace” for its move higher “if past patterns hold.”
Crypto market data daily view. Source:Coin360
Yoni Assia, CEO of eToro, also told Cointelegraph that Bitcoin could see a sharp rise “over the next three to five years, as there are still 5 billion people in the world that basically don’t have good local currency.”
Related: Bitcoin price could hit $85K in months as indicators flip bullish — report.
Therefore, investors should not be discouraged by the muted price action in the short term. Bitcoin’s fundamentals remain strong and are likely to result in a new uptrend in the future.
As crypto markets consolidate, let’s analyze the charts of the top-5 cryptocurrencies that may outperform in the next few days.
BTC/USDT
Bitcoin turned down from the resistance line of the descending triangle on Jan. 12 and broke below the 20-day exponential moving average ($36,586). This suggests that the bears are aggressively defending the resistance line.
BTC/USDT daily chart. Source: TradingView
The longer the price stays below the 20-day EMA, the greater the chances of a drop to the lower levels. If bears sink the price below $34,600, the BTC/USDT pair could drop to $33,400 and then to $31,000.
A break and close below $31,000 will complete a descending triangle pattern, which has a target objective at $19,549. However, it is unlikely to be a straight drop to the lower levels because the bulls will attempt to stall the decline in the $31,000 to $28,000 support zone.
This negative view will invalidate if the price continues to move up and rises above the resistance line of the triangle. Such a move could open the gates for a rise to the 50-day simple moving average ($44,709), which is again likely to act as a stiff resistance.
A break above the 50-day SMA will suggest that the correction could be over and the bulls will gradually try to start a new up-move.
BTC/USDT 4-hour chart. Source: TradingView
The moving averages on the 4-hour chart have been crossi each other and the relative strength index (RSI) is just above the midpoint, indicating that bulls are trying to make a comeback.
A breakout and close above the resistance line of the triangle will signal that demand exceeds supply. If the bulls sustain the price above the triangle, a new up-move could begin.
Alternatively, if the price turns down from the resistance line and breaks below $34,000, it could signal a minor advantage to the bears. That could pull the price down to the critical support at $31,000. A bounce off this support will suggest accumulation at lower levels and that could keep the pair inside the triangle for some more time.
AAVE/USDT
Aave is trading inside a large range between $280 and $581.67 for the past few months. The bulls have successfully defended the support of the range on five previous occasions, hence the buyers are likely to buy the dip once again.
AAVE/USDT daily chart. Source: TradingView
If the price rebounds off the current level with strength, it will suggest that the bulls continue to accumulate on dips. The buyers will then try to push the price above the 20-day EMA ($344). If they succeed, the AAVE/USDT pair could rise to the 50-day SMA ($414), which may act as a stiff hurdle.
If the price turns down from the 50-day SMA, the pair could consolidate between $280 and $414 for a few days. On the contrary, a break above the 50-day SMA will clear the path for a northward march toward $581.67.
This positive view will invalidate if the price turns down from the 20-day EMA and breaks below the $280 support. That will embolden the bears who will then try to pull the price down to $208.09 and then to $160.
AAVE/USDT 4-hour chart. Source: TradingView
The 4-hour chart shows the bears had pulled the price below $280 but they are struggling to sustain the lower levels. However, the moving averages are sloping down and the RSI is in the negative zone, indicating advantage to the bears.
If the price turns down from the current level and breaks below $266.68, the pair could start its downward journey. This negative view will invalidate if the bulls push the price above the downtrend line. Such a move will suggest the correction is over and the pair could then rise to $500.
KSM/USDT
Kusama (KSM) has been witnessing volatile moves in the past few days. Although the bulls pushed the price above the $480 overhead resistance on June 9, they could not sustain the higher levels and the price dipped back below the level on June 10. This shows that bears are selling on rallies.
KSM/USDT daily chart. Source: TradingView
However, the buyers have not allowed the price to break below the 20-day EMA ($388). This suggests that the sentiment is turning positive as the bulls are buying the dips to the 20-day EMA.
The rising 20-day EMA and the RSI near the midpoint indicate a minor advantage to the bulls. The buyers will now make one more attempt to push the price above $480. If they succeed, the KSM/USD pair could rally to $537 and then retest the all-time high at 625.
This positive view will invalidate if the price turns down from the current level or the overhead resistance and breaks below $360. That could pull the price down to $280.
KSM/USDT 4-hour chart. Source: TradingView
The 4-hour chart shows the bulls are trying to defend the trendline support. However, the 20-EMA has turned down and the RSI is in the negative zone, indicating the bears have the upper hand.
If the sellers sink the price below $380, the pair could drop to $342. A break below this support could result in a decline to $280.
This negative view will invalidate if the bulls can push the price above $429. That could attract buying, pushing the pair to $480.
ALGO/USDT
Algorand (ALGO) bounced off the trendline on June 12 and rose above the 20-day EMA ($0.97), which suggests the bulls are buying on dips. The flattish 20-day EMA and the RSI near the midpoint suggest the selling pressure has reduced.
ALGO/USDT daily chart. Source: TradingView
The price action of the past few days has formed an ascending triangle pattern, which will complete on a breakout and close above $1.15. If the bulls manage to sustain the price above $1.15, the ALGO/USDT pair could rally to the target objective at $1.63.
Contrary to this assumption, if the price turns down from $1.15, the pair may extend its stay inside the triangle for a few more days. A breakdown and close below the trendline will nullify the bullish view and open the gates for a drop to $0.80 and then $0.67.
ALGO/USDT 4-hour chart. Source: TradingView
The 4-hour chart shows the bulls are attempting to push the price above the downtrend line. If they can sustain the breakout, the pair could rise to $1.15. A breakout and close above this resistance could start a new uptrend.
Conversely, if the price turns down from the current level and breaks below the moving averages, the bears will make one more attempt to sink the price below the trendline. If they succeed, it will signal the start of a deeper correction.
TFUEL/USDT
Theta Fuel (TFUEL) soared to a new all-time high at $0.679 on June 9 but the bulls could not sustain the higher levels as seen from the long wick on the day’s candlestick. That was followed by a sharp pullback to the 20-day EMA ($0.41) on June 12.
TFUEL/USDT daily chart. Source: TradingView
The strong rebound off the 20-day EMA shows the sentiment is positive and traders are aggressively buying on dips. The bulls will now try to push the price to the all-time high where they are likely to encounter stiff resistance from the bears.
If the price turns down from the all-time high, the bears will make one more attempt to pull the price below the 20-day EMA. If they succeed, it will suggest the start of a deeper correction.
Alternatively, if buyers propel the price above the all-time high, the TFUEL/USDT pair could resume the uptrend, with the next target objective at $0.85 and then $1.
TFUEL/USDT 4-hour chart. Source: TradingView
The 4-hour chart shows the pair rebounded strongly off the $0.40 support, which suggests accumulation at lower levels. However, the relief rally is facing resistance just below the 61.8% Fibonacci retracement level at $0.57.
This suggests that the bears have not given up yet and are selling on rallies. If the price dips below the 20-EMA, the bears will try to pull the price down to $0.40. If that happens, the pair may consolidate between these two levels for a few days.
Alternatively, if the price rebounds off the 20-EMA, it will indicate the sentiment is positive and the bulls are not waiting for a deeper fall to buy. That will increase the possibility of a break above $0.57. The pair could then rise to retest the all-time high.
The views and opinions expressed here are solely those of the author and do not necessarily reflect the views of Cointelegraph. Every investment and trading move involves risk, you should conduct your own research when making a decision.