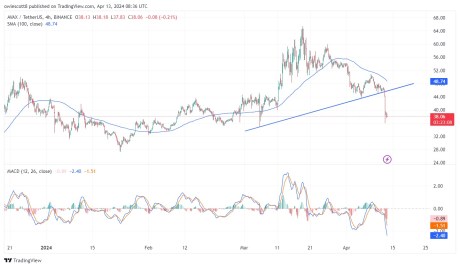
Generally, the cryptocurrency market is bearish at the moment, with coins like Avalanche (AVAX), Ethereum, Litecoin, XRP, Solana, and others all caught in this trend. Currently, the price of AVAX is on a strong bearish move below the 100-day Moving Average (MA) and could continue in that direction for a while before retracing.
Technical Indicators Suggest A Bearish Trend For Avalanche
Observing the chart from the 4-hour timeframe, AVAX has crossed below both the 100-day moving average and the trend line. This could mean that the price is on a downward trend. The MACD indicator on the 4-hour timeframe suggests a very strong bearish movement as the MACD histograms are trending below the MACD zero line.
Also, both the MACD line and MACD signal line are trending below the zero line. Given the formation of the MACD indicator, it shows that there is a possibility that the price will still move further downward.
Furthermore, the Relative Strength Index (RSI) also on the 4-hour timeframe suggests a bearish trend as the RSI signal line is trending around the oversold zone. Despite the potential of a retracement at this point, the price will drop more following this.
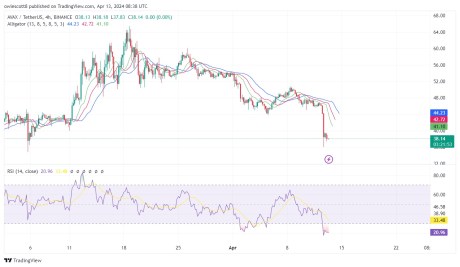
The alligator indicator is another powerful tool used to determine the trend of an asset. A look at the above image shows that both the alligator’s lip and teeth have crossed over the alligator’s jaw facing the downward direction. This formation suggests that the trend is bearish and that the price could witness a deeper decline.
What Could Happen Next
Based on the price’s previous movement, there are two major resistance levels of $50 and $59.99 and a support level of $39.95. As Avalanche is on a negative trajectory, if prices manage to break below the support level of $39.95, it could trigger a move further toward the next low of $27.53.
On the other hand, if the price fails to break below its previous low, it might start an upward correction movement toward the resistance level of $50.80. However, if it manages to break past this level, AVAX might move even further toward the $59.99 resistance level.
As of the time of writing, the Avalanche was trading around $38, indicating a decline of 1.75% in the last 24 hours. Its market cap is down by over 16%, while its trading volume has increased significantly by nearly 250% in the past day.
AVAX trading at $38 on the 1D chart | Source: AVAXUSDT on Tradingview.com
Featured image from Shutterstock, chart from Tradingview
Disclaimer: The article is provided for educational purposes only. It does not represent the opinions of NewsBTC on whether to buy, sell or hold any investments and naturally investing carries risks. You are advised to conduct your own research before making any investment decisions. Use information provided on this website entirely at your own risk.
Terraform Labs (TFL) and the Luna Foundation Guard (LFG) have announced they have purchased a combined $200 million worth of AVAX tokens from the Avalanche Foundation.
TFL, the company responsible for the development of the Terra blockchain, swapped $100 million worth of Terra’s native token, LUNA for AVAX tokens, in order to “strategically align ecosystem incentives”, according to Terra’s twitter.
LFG, a non-profit organization mandated to build reserves for Terra’s algorithmic stablecoin UST, used its own holdings of UST to purchase an additional $100 million worth of AVAX from the Avalanche Foundation.
These purchases are meant to reinforce the stability of Terra’s native UST stablecoin, which currently has a market cap of $16.7 billion.
Do Kwon, the founder of Terraform Labs, told Bloomberg that LFG selected AVAX for its UST reserves because of solid growth in the blockchain’s ecosystem as well as the stark loyalty of its users.
“Avalanche is still a growing ecosystem — a lot of it is fueled by loyalty to the AVAX token and users feel a lot of affinity with an asset that aligns itself with AVAX…whereas for the average Ethereum user, aligning yourself with Ether doesn’t really mean that much.”
As Terra continues to strengthen the position of UST, competitors are looking for new ways to dethrone the stablecoin. Near Protocol (NEAR), a Layer-1 blockchain and competitor to both Ethereum and Terra, is rumored to be releasing a stablecoin called USN, which will reportedly also offer a decentralized finance protocol capable of providing users with a 20% annual percentage yield (APY) on their USN deposits.
This is similar to the Terra ecosystem’s Anchor protocol which currently offers users a 19.49% APY on UST deposits.
In a Substack post detailing what he understands of the plans, Crypto Insiders Telegram group founder Zoran Kole argued that Near protocol was superior to both Etheruem and Terra, offering data from Electric Capital that outlined Near Protocol’s substantial growth in terms of development.
Source: Zoran Kole
Kole concluded that Near’s network growth combined with its soon-to-be-released USN stablecoin and subsequent DeFi protocols could eventually allow for Near Protocol with an $11.7 billion market cap to catch up to and eventually eclipse Terra, which has a market cap of $37.2 billion.
“This will lead to a comparison of Near to Terra ($LUNA) as the narrative for attractive stablecoin yields proliferates.”
Crypto markets are expected to remain volatile for the foreseeable future, but BTC’s battle to reclaim $40,000 could be followed with rallies from LUNA, AVAX, ATOM and FTM.
Bitcoin (BTC) and the U.S. equity markets fell sharply on Jan. 5, reacting negatively to the minutes from the Federal Reserve’s December FOMC meeting, which showed that the members expect the balance sheet reduction to start after the Fed begins hiking interest rates in early 2022.
Adding to the negative sentiment was the shutdown of the world’s second-biggest Bitcoin mining hub in Kazakhstan, where the internet has been shut down following massive protests by citizens. This caused a dip of about 13.4% in the Bitcoin network’s overall hash rate from 205,000 petahash per second (PH/s) to 177,330 PH/s.
According to Galaxy Digital Holdings CEO Mike Novogratz, the current decline was with low volumes and he believes that the markets will be volatile in the next few days. Novogratz suggests that a huge amount of “institutional demand” was waiting on the sidelines and he expects Bitcoin to bottom out in the $38,000 to $40,000 zone.
Could Bitcoin and major altcoins continue to face selling or will they bounce off strong support levels? Let’s study the charts of the top-10 cryptocurrencies to find out.
BTC/USDT
The range-bound action in Bitcoin resolved to the downside on Jan. 5 when bears pulled the price below the strong support at $45,456. This suggests that supply exceeds demand.
BTC/USDT daily chart. Source: TradingView
There was a meek attempt to defend the $42,500 support on Jan. 6 but sustained selling has pulled the price close to the next support at $39,600. This leg down has invalidated the positive divergence that was forming on the relative strength index (RSI).
The downsloping moving averages and the RSI near the oversold zone suggest that bears are in control. If bears sink and sustain the price below $39,600, the BTC/USDT pair could nosedive to $30,000.
On the contrary, if the price rebounds off $39,600, the bulls will again try to push the pair above the 20-day exponential moving average ($46,811). Such a move will be the first indication that the downtrend could be ending.
The bullish momentum could pick up on a break and close above the 50-day simple moving average ($50,610).
ETH/USDT
Ether (ETH) turned down from the 20-day EMA ($3,756) on Jan. 5 and plunged below the Dec. 4 intraday low at $3,503.68. This suggests that bears have reasserted their supremacy.
ETH/USDT daily chart. Source: TradingView
The downsloping moving averages and the RSI in the oversold zone suggest that bears are in command. If bears sustain the price below $3,250, the decline could extend to the support line of the channel.
The bulls will attempt to defend this level and push the price to the resistance line of the channel. A break and close above the channel will signal a change in trend.
Alternatively, if bears sink the price below the channel, the ETH/USDT pair could decline to the strong support at $2,652.
BNB/USDT
Binance Coin (BNB) broke below the strong psychological support at $500 on Jan. 5. Follow-up selling has pulled the price to the next support at $435.30.
BNB/USDT daily chart. Source: TradingView
If the price bounces off the current level, the BNB/USDT pair could rally to $500 where the bears are likely to mount a stiff resistance. The downsloping moving averages and the RSI in the oversold zone suggest that bears are in control.
If the $435.30 support gives way, the pair could extend its decline to $392.20 and later to $320. This negative view will be negated if the price breaks and sustains above the channel. Such a move could open the doors for a possible move to $575.
SOL/USDT
Solana (SOL) plummeted below $167.88 and the Dec. 13 intraday low at $148.04 on Jan. 5. This indicated that bears have reasserted their dominance.
SOL/USDT daily chart. Source: TradingView
The selling has continued and the bears will now try to pull the SOL/USDT pair to the strong support at $116. This level could attract strong buying from the bulls but the relief rally is likely to face selling near the 20-day EMA ($170).
Such a move will indicate that the sentiment remains negative and traders are selling on rallies. That could increase the likelihood of a break below $116. The next stop may be the support line of the channel.
The buyers will have to push and sustain the pair above the resistance line of the channel to signal that the downtrend could be ending.
ADA/USDT
Cardano (ADA) turned down from the 20-day EMA ($1.33) on Jan. 5 and dropped to the strong support at $1.18. The bulls have successfully defended this level but have failed to push the price above the 20-day EMA.
ADA/USDT daily chart. Source: TradingView
If bears pull the price below $1.18, the ADA/USDT pair could drop to the critical support at $1. This is an important support to watch out for because if it cracks, the selling momentum could pick up and the pair could slide to $0.68.
On the contrary, if bulls drive the price above the moving averages, the pair could rise to the resistance line of the channel. A break and close above the channel will signal a possible change in trend. The pair could then rally to $1.87.
XRP/USDT
XRP broke below the $0.75 support on Jan. 5 but the long tail on the candlestick suggests that bulls purchased this dip. However, a minor negative is that the buyers have not been able to build upon the rebound.
XRP/USDT daily chart. Source: TradingView
The XRP/USDT pair formed a Doji candlestick pattern on Jan. 8 and the bulls are currently attempting to sink the price below $0.75. If that happens, the downtrend could resume and the pair may drop to $0.60.
The downsloping moving averages and the RSI in the negative zone indicate that bears are in command. Contrary to this assumption, if the price rebounds off the current level, the bulls will attempt to push the pair above the moving averages.
If they succeed, it will suggest that the selling pressure may be reducing. The pair could then rise to $1.
LUNA/USDT
Terra’s LUNA token plummeted below the 20-day EMA ($81) on Jan. 5, indicating that short-term traders may have booked profits after bulls failed to clear the hurdle at $93.81.
LUNA/USDT daily chart. Source: TradingView
The bears have pulled the price to the 50-day SMA ($69), which may act as a strong support. If the price rebounds off the current level, the bulls will try to push the LUNA/USDT pair to the downtrend line of the descending channel.
A break and close above the channel will indicate that the correction may be over. The bulls will then try to push the price to $93.81. On the contrary, a break and close below the 50-day SMA could intensify selling and the pair may drop to the psychological support at $50.
Related: Bitcoin and Ether heading $100K and $5K in 2022: Bloomberg Intelligence
DOT/USDT
Polkadot (DOT) is range-bound in a downtrend. The price has been oscillating between $22.66 and $32.78 for the past few days.
DOT/USDT daily chart. Source: TradingView
The 20-day EMA ($28) has started to turn down and the RSI has dipped into the negative territory, suggesting that bears have the upper hand. If sellers sink and sustain the price below $22.66, the DOT/USDT pair could plunge to $16.81.
Contrary to this assumption, if the price rebounds off $22.66, the bulls will try to push the pair to $32.78. A break and close above this level could signal a possible change in trend. The pair could first rise to $40 and later to $44.
AVAX/USDT
Avalanche (AVAX) broke below the $98 support on Jan. 5 and has dropped to the uptrend line of the symmetrical triangle today. The bulls will attempt to defend this level and push the price back to the downtrend line.
AVAX/USDT daily chart. Source: TradingView
The 20-day EMA ($104) has turned down and the RSI is below 38, indicating that rallies are likely to be sold into. If the bounce off the current level turns down either from $98 or from the 20-day EMA, the possibility of a break below the triangle increases.
The AVAX/USDT pair could then decline to the $75.50 support where the bulls will try to arrest the decline. This negative view will invalidate if the price turns up and breaks above the triangle. The pair could then rise to $128.
DOGE/USDT
Dogecoin (DOGE) dipped below the $0.15 support on Jan. 5 but the long tail on the candlestick shows that bulls defended this level. That was followed by a Doji candlestick pattern on Jan. 6, indicating indecision among the bulls and the bears.
DOGE/USDT daily chart. Source: TradingView
The bears tried to resolve the uncertainty to the downside today but the bulls are not willing to relent. However, unless buyers quickly push the DOGE/USDT pair above the 20-day EMA ($0.17), the risk of a break and close below $0.15 increases.
If that happens, the pair could slide to $0.13 and then to $0.10. Alternatively, if bulls push the price above the 20-day EMA, it will suggest that buyers are attempting a comeback. The pair could then rise to $0.19 and if bulls clear this hurdle, the rally may extend to $0.22.
The views and opinions expressed here are solely those of the author and do not necessarily reflect the views of Cointelegraph. Every investment and trading move involves risk. You should conduct your own research when making a decision.
Bitcoin (BTC) is witnessing a tough tussle near the $58,000 mark but that has not stopped select altcoins from hitting a new all-time high. This shows that traders are watching the fundamental developments on individual coins.
One of the recent top performing major altcoins has been Avalanche (AVAX), which has soared more than 120% in November. The coin caught traders’ attention leading up to the announcement by accounting firm Deloitte which plans to build its disaster relief platforms on the Avalanche blockchain.
Crypto market data daily view. Source:Coin360
In another step that shows growing crypto adoption, El Salvador’s President Nayib Bukele announced the launch of Bitcoin city, which will be powered by geothermal energy and initially funded by $1 billion worth of Bitcoin bonds.
Could strong buying at lower levels boost Bitcoin above $60,000 and will altcoins participate in the recovery? Let’s study the charts of the top-5 cryptocurrencies that could attract traders’ attention in the short term.
BTC/USDT
Bitcoin reversed direction from $55,600 on Nov. 19 but the recovery is facing resistance at the 50-day simple moving average ($60,187). The moving averages are on the verge of a bearish crossover and the relative strength index (RSI) is in the negative area, indicating that bears are making a strong comeback.
BTC/USDT daily chart. Source: TradingView
If the price turns down from the current level, the bears will attempt to extend the correction by pulling the BTC/USDT pair below $55,600. If that happens, the next stop could be the strong support zone at $52,500 to $50,000.
If the price rebounds off this zone, the bulls will try to push the pair above the moving averages and the downtrend line. Such a move will indicate that the corrective phase may be over. The bulls will then try to drive the price above the all-time high at $69,000.
Alternatively, a break below the psychological support at $50,000 could intensify selling as traders rush to the exit. The pair could then drop to $45,000 and later to $40,000.
BTC/USDT 4-hour chart. Source: TradingView
The 4-hour chart shows that bears pulled the price below the strong support at $58,000 but they could not build upon this advantage. The bulls bought the dip and have pushed the price back above the 20-exponential moving average.
If the price sustains above $58,000, the pair could rally to the downtrend line. A break and close above this resistance could indicate that bulls have the upper hand. The pair could then rally to $62,000 and later to $67,000.
Conversely, if the price turns down from the current level and breaks below $55,600, it will signal the possible start of a deeper correction.
AVAX/USDT
Avalanche is in a strong uptrend and has consistently been making new highs for the past few days. The bulls pushed the price above the 200% Fibonacci extension level at $146.18 today but the long wick on the day’s candlestick shows profit-booking at higher levels.
AVAX/USDT daily chart. Source: TradingView
The rising 20-day EMA (96) indicates that bulls are in command but the RSI near 80 suggests that the rally may be overheated in the near term. This could result in a minor correction or consolidation in the next few days.
If the price turns down from the current level, $110 and then the 20-day EMA may act as a strong support. A sharp rebound off either level will suggest that the bulls are viewing the dips as a buying opportunity. The pair could then march toward the 261.8% Fibonacci extension level at $175.58.
Contrary to this assumption, if the price breaks below the 20-day EMA, it will suggest that traders are rushing to the exit. That may pull the AVAX/USDT pair to $81.
AVAX/USDT 4-hour chart. Source: TradingView
The pair has turned down from $147, indicating aggressive profit-booking at higher levels. The bears will now attempt to pull the price to the 20-EMA, which is likely to act as a strong support.
If the price rebounds off the 20-EMA, it will indicate strong buying on dips. The bulls will then try to resume the uptrend by pushing the pair above $147.
Contrary to this assumption, if the price breaks below the 20-EMA, the selling could accelerate and the pair may drop to $110. Such a move will suggest that the bulls may be losing their grip. The pair could thereafter drop to the 50-SMA.
MATIC/USDT
Polygon (MATIC) has been trading inside an ascending channel pattern for the past few days. The bulls pushed the price above the resistance line of the channel on Oct. 28 and 29 but failed to sustain the breakout. This may have prompted selling from short-term traders.
MATIC/USDT daily chart. Source: TradingView
The bears again successfully defended the resistance line on Nov. 3. This started the downward journey toward the trendline of the channel. The downsloping 20-day EMA ($1.69) and the RSI just below the midpoint indicate a minor advantage to sellers.
If the price turns down from the current level, the MATIC/USDT pair could drop to the trendline. The bulls are expected to defend this level aggressively. If the price rebounds off the trendline and rises above the 20-day EMA, it will indicate that the selling pressure may be reducing. That may signal the start of the northward journey toward the resistance line.
Contrary to this assumption, if bears sink the price below the trendline, it could result in a decline to the psychological support at $1.
MATIC/USDT 4-hour chart. Source: TradingView
The 4-hour chart shows that bulls are attempting to stage a relief rally from the strong support zone at $1.50 to $1.40. The 20-EMA has started to turn up and the RSI is near the center, indicating that the selling pressure may be reducing.
If bulls drive the price above $1.70, the pair could rise to $1.80. A break and close above this level will indicate strength. The pair could then start its up-move toward $2.15. On the downside, the selling may accelerate if the bears pull the price below $1.40.
Related: Seeing red? FUD that! Here’s what you should have bought instead of Bitcoin last week
EGLD/USDT
The bears tried to pull Elrond (EGLD) below the breakout level at $303.03 from Nov. 16 to 18 but the bulls bought the dips as seen from the long tail on the candlesticks. Strong buying on Nov. 19 pushed the price above the overhead resistance at $338.70.
EGLD/USDT daily chart. Source: TradingView
This resumed the uptrend and the EGLD/USDT pair has reached near its pattern target at $427. The sharp rally has pushed the RSI deep into the overbought zone, suggesting that a minor consolidation or correction could be around the corner.
The first support on the downside is the breakout level at $338.70 and then the 20-day EMA ($325). If the price rebounds off either level, it will suggest that traders continue to buy on dips. The bulls will then try to resume the uptrend with the next target objective at $500.
This positive view will be invalidated if the price turns down and plummets below the breakout level at $303.
EGLDT/USDT 4-hour chart. Source: TradingView
The 4-hour chart shows that bears tried to stall the up-move at $400 but the bulls were in no mood to relent. Sustained buying at higher levels pushed the pair above the psychological barrier. The rising 20-EMA and the RSI in the overbought zone indicate that bulls are firmly in the driver’s seat.
The first important level to watch on the downside is $380. If bears pull the price below this support, the pair may drop to the 20-EMA. A strong rebound off this support could keep the uptrend intact but a break below it will suggest that the bullish momentum may be weakening.
MANA/USDT
Decentraland (MANA) turned down from the 78.6% Fibonacci retracement level at $4.35 on Nov. 20. This indicates that traders may be selling on rallies.
MANA/USDT daily chart. Source: TradingView
The MANA/USDT pair could now drop to the immediate support at $3.50 and if this level gives way, the correction could deepen to the 20-day EMA ($3.11). If the price rebounds off either support, it will suggest that sentiment remains positive and traders are buying on dips.
The bulls will then attempt to push the price to $4.36. A break and close above this resistance could open the doors for a rally to $4.94. This positive view will invalidate if the price continues lower and breaks below the 20-day EMA.
MANA/USDT 4-hour chart. Source: TradingView
The pair has been rising inside an ascending channel pattern. The failure of the bulls to push the price above the resistance line may have prompted selling from traders, pulling the price below the 20-EMA.
Both moving averages have flattened out and the RSI has dipped near the midpoint, suggesting that the bullish momentum may be weakening. The pair could now drop to the trendline of the channel where buying may emerge.
If the price rebounds off the trendline, the pair could continue its up-move inside the channel. The buyers will then try to push the price to the resistance line. The bullish momentum could pick up on a break and close above the channel.
The views and opinions expressed here are solely those of the author and do not necessarily reflect the views of Cointelegraph. Every investment and trading move involves risk, you should conduct your own research when making a decision.
Starting today, Avalanche (AVAX) is available on Coinbase.com and in the Coinbase Android and iOS apps. Coinbase customers can now trade, send, receive, or store AVAX in most Coinbase-supported regions, with certain exceptions indicated in each asset page here. Trading for these assets is also supported on Coinbase Pro .
Avalanche (AVAX)describes itself as an open, programmable smart contracts platform for decentralized applications. AVAX is used to pay transaction fees and can be staked to secure the network. Avalanche is compatible with Solidity, Ethereum’s programming language, and can be used to deploy custom private or public blockchains as “subnets.”
One of the most common requests we hear from customers is to be able to buy and sell more cryptocurrencies on Coinbase. We announced a process for listing assets, designed in part to accelerate the addition of more cryptocurrencies. We are also investing in new tools to help people understand and explore cryptocurrencies. We launched informational asset pages (see AVAX), as well as a new section of the Coinbase website to answer common questions about crypto.
Customers can sign up for a Coinbase account here to buy, sell, convert, send, receive, or store e Coinbase Android and iOS apps. Coinbase customers can now trade, send, receive, or store AVAX today.
Please note: Coinbase Ventures may be an investor in the crypto projects mentioned here, and additionally, Coinbase may hold such tokens on its balance sheet for operational purposes. A list of Coinbase Ventures investments is available at https://ventures.coinbase.com/. Coinbase intends to maintain its investment in these entities for the foreseeable future and maintains internal policies that address the timing of permissible disposition of any related digital assets, if applicable. All assets, regardless of whether Coinbase Ventures holds an investor or Coinbase holds for operational purposes, are subject to the same strict review guidelines and review process.
This website contains links to third-party websites or other content for information purposes only (“Third-Party Sites”). The Third-Party Sites are not under the control of Coinbase, Inc., and its affiliates (“Coinbase”), and Coinbase is not responsible for the content of any Third-Party Site, including without limitation any link contained in a Third-Party Site, or any changes or updates to a Third-Party Site. Coinbase is not responsible for webcasting or any other form of transmission received from any Third-Party Site. Coinbase is providing these links to you only as a convenience, and the inclusion of any link does not imply endorsement, approval or recommendation by Coinbase of the site or any association with its operators.
Crypto is a new type of asset. Besides potential day to day or hour to hour volatility, each crypto asset has unique features. Make sure you research and understand individual assets before you transact.
All images provided herein are by Coinbase.
Avalanche (AVAX) is now available on Coinbase was originally published in The Coinbase Blog on Medium, where people are continuing the conversation by highlighting and responding to this story.
Starting Today, Wednesday September 29, transfer AVAX into your Coinbase Pro account ahead of trading. Support for AVAX will generally be available in Coinbase’s supported jurisdictions with certain exceptions as indicated in each asset page here. Trading will begin on or after 9AM Pacific Time (PT) Thursday September 30, if liquidity conditions are met.
Please note:Coinbase Pro only supports C-Chain Avalanche (AVAX) tokens. C-chain Avalanche addresses start with ‘0x’. Sending Avalanche on P-chain or X-chain or any other assets to a Coinbase Pro wallet will result in permanent loss.
One of the most common requests we receive from customers is to be able to trade more assets on our platform. Per the terms of our listing process, we anticipate supporting more assets that meet our standards over time. Most recently we have added trading support for Adventure Gold (AGLD), Braintrust (BTRST), Rari Governance Token (RGT) and XYO Network (XYO), DerivaDAO (DDX), DFI.money (YFII), Radicle (RAD), COTI (COTI), Axie Infinity (AXS), Request (REQ), TrueFi (TRU), Wrapped Luna (WLUNA), Harvest Finance (FARM) Fetch.ai (FET) Paxos Standard (PAX) and Polymath Network (POLY), Clover Finance (CLV), Mask Network (MASK), and Rally (RLY).
Starting Today, Wednesday September 29, we will begin accepting inbound transfers of AVAX to Coinbase Pro. Trading will begin on or after 9AM Pacific Time (PT) Thursday September 30, if liquidity conditions are met.
Once sufficient supply of AVAX is established on the platform, trading on our AVAX-USD, AVAX-USDT and AVAX-EUR order books will launch in three phases, post-only, limit-only and full trading. If at any point one of the new order books does not meet our assessment for a healthy and orderly market, we may keep the book in one state for a longer period of time or suspend trading as per our Trading Rules.
We will publish tweets from our Coinbase Pro Twitter account as each order book moves through the phases.
Avalanche (AVAX)describes itself as an open, programmable smart contracts platform for decentralized applications. AVAX is used to pay transaction fees and can be staked to secure the network. Avalanche is compatible with Solidity, Ethereum’s programming language, and can be used to deploy custom private or public blockchains as “subnets.”
AVAX is not yet available on Coinbase.com or via our Consumer mobile apps. We will make a separate announcement if and when this support is added.
You can sign up for a Coinbase Pro account here to start trading. For more information on trading AVAX on Coinbase Pro, visit our support page.
### Please note: Coinbase Ventures may be an investor in the crypto projects mentioned here, and additionally, Coinbase may hold such tokens on its balance sheet for operational purposes. A list of Coinbase Ventures investments is available at https://ventures.coinbase.com/. Coinbase intends to maintain its investment in these entities for the foreseeable future and maintains internal policies that address the timing of permissible disposition of any related digital assets, if applicable. All assets, regardless of whether Coinbase Ventures holds an investor or Coinbase holds for operational purposes, are subject to the same strict review guidelines and review process. This website contains links to third-party websites or other content for information purposes only (“Third-Party Sites”). The Third-Party Sites are not under the control of Coinbase, Inc., and its affiliates (“Coinbase”), and Coinbase is not responsible for the content of any Third-Party Site, including without limitation any link contained in a Third-Party Site, or any changes or updates to a Third-Party Site. Coinbase is not responsible for webcasting or any other form of transmission received from any Third-Party Site. Coinbase is providing these links to you only as a convenience, and the inclusion of any link does not imply endorsement, approval or recommendation by Coinbase of the site or any association with its operators.
Crypto is a new type of asset. Besides potential day to day or hour to hour volatility, each crypto asset has unique features. Make sure you research and understand individual assets before you transact.
All images provided herein are by Coinbase.
Avalanche (AVAX) is launching on Coinbase Pro was originally published in The Coinbase Blog on Medium, where people are continuing the conversation by highlighting and responding to this story.
China has attempted to stifle the crypto sector’s growth on several occasions in the past 12 years but barring a minor blip, the blanket bans on crypto-commerce have not altered the long-term growth of cryptocurrencies. This shows that no one country, even if it is the second-largest economy in the world, can halt the emergence and growth of cryptocurrencies.
Deutsche Bank analyst Marion Laboure said in an update on the bank’s website that Bitcoin (BTC) is likely to “remain ultra-volatile in the foreseeable future” as most people buy it either for investment or for speculation rather than using it as a medium of exchange.
However, Laboure believes that Bitcoin could become “the 21st century’s digital gold” and the trend could continue for centuries with no major control by the government.
Crypto market data daily view. Source:Coin360
At Morningstar’s yearly investment conference, Dennis Lynch, the head of asset management at Counterpoint, likened Bitcoin to the South Park cartoon character Kenny. Lynch said: “I like to say that bitcoin’s kind of like Kenny from South Park — he dies every episode, and is back again.”
As the effect of the China FUD diminishes, let’s study the charts of the top-5 cryptocurrencies that may remain strong in the short term.
BTC/USDT
Bitcoin has once again bounced off the 100-day simple moving average ($41,002), suggesting that bulls are attempting to defend this level aggressively. The bulls will now try to push the price above the 20-day exponential moving average ($45,178).
BTC/USDT daily chart. Source: TradingView
The downsloping 20-day EMA and the relative strength index (RSI) in the negative zone suggest that bears have the upper hand. If the price turns down from the 20-day EMA, the possibility of a break below the 100-day SMA will increase.
Such a move will complete the bearish head and shoulders pattern, which has a target objective at $32,423.05.
The bulls will have to push and sustain the price above the overhead resistance at $48,843 to open the doors for a possible rally to $52,920. A break and close above this level could signal the resumption of the uptrend.
BTC/USDT 4-hour chart. Source: TradingView
The BTC/USDT pair is witnessing a tough tussle between the bulls and the bears near the neckline. The bulls have pushed the price above the 20-EMA and will next try to clear the overhead hurdle at $45,200.
If they can pull it off, the pair could climb to $49,000. Conversely, if the price turns down from the current level, the bears will try to pull the price below the critical support zone at $41,000 to $39,600. A violation of this zone may indicate the start of a downtrend.
AVAX/USDT
Avalanche (AVAX) is trading inside an ascending channel pattern. The long tail on today’s candlestick suggests that bulls are aggressively buying on dips to the 20-day EMA ($61).
AVAX/USDT daily chart. Source: TradingView
The rising moving averages and the RSI in the positive zone indicate advantage to buyers. The AVAX/USDT pair could now try to retest the all-time high at $79.80. This is an important level to watch out for because a break above it could signal the resumption of the uptrend.
The pair could then rally to the resistance line of the channel and the bullish momentum may pick up if this hurdle is crossed.
Conversely, if the price turns down from the current level or the overhead resistance and breaks below $60.04, it will suggest the start of a deeper correction to the 50-day SMA ($45).
AVAX/USDT 4-hour chart. Source: TradingView
The pair has bounced off the 100-SMA and the bulls are attempting to sustain the price above the 20-EMA. If they manage to do that, the pair could start its northward march to $79.80 where the bears may again mount a stiff resistance.
On the downside, the critical level to watch is the support line of the channel. A break and close below this support will be the first indication that the bulls may be losing their grip. If the price slips below $60.04, the decline could extend to $55.
ALGO/USDT
Algorand (ALGO) is trading below the 20-day EMA ($1.77) but the long tail on today’s candlestick suggests that bulls are attempting to defend the support at $1.51.
ALGO/USDT daily chart. Source: TradingView
If bulls drive and sustain the price above the downtrend line, it will suggest that the short-term correction could be over. The ALGO/USDT pair could then rise to $2.15 and then to $2.55.
Alternatively, if the price turns down from $1.84, the pair could again drop to $1.51. If the bulls defend this support, the pair may remain range-bound between $1.84 and $1.51 for a few days.
A break and close below $1.51 will signal a possible change in trend. The pair could then slide to the next support at $1.15.
ALGO/USDT 4-hour chart. Source: TradingView
The pair is trying to rebound off the strong support at $1.51 but the recovery may hit a barrier at the moving averages and then again at the downtrend line.
If the price turns down from the overhead resistance, it will indicate that sentiment remains negative and traders are selling on relief rallies. That will increase the likelihood of a break below $1.51.
This negative view will be negated if the price rises and sustains above the downtrend line. The bulls will then make one more attempt to resume the up-move.
Related: Derivatives data suggests Solana has reached a short-term top
XTZ/USDT
Tezos (XTZ) rebounded sharply from the breakout level at $4.47 on Sept.22, indicating aggressive buying on dips. The bulls pushed the price back above the 20-day EMA ($6.10) on Sept. 23 and have held the level since then.
XTZ/USDT daily chart. Source: TradingView
The moving averages are sloping up and the RSI is in the positive territory, suggesting that bulls have the upper hand. The buyers are likely to challenge the overhead resistance zone at $8.03 to $8.42.
A breakout and close above this zone will signal the start of the next leg of the uptrend. The pair could then rally to the psychological mark at $10.
Contrary to this assumption, if the price turns down from the current level or the overhead resistance and breaks below the 20-day EMA, the pair could drop to $4.47.
XTZ/USDT 4-hour chart. Source: TradingView
The pair is attempting to rebound off the 20-EMA, indicating that sentiment has turned positive and traders are buying on dips. The bulls will now try to push the price to the overhead resistance at $7.50.
If this level is scaled, the pair may rally to $8.03 where the bears are likely to mount a stiff resistance. If bulls do not give up much ground from this resistance, the possibility of a break above it will increase.
This bullish view will invalidate if the price turns down and breaks below the moving averages. Such a move could result in a drop to $5.50 and then $4.47.
EGLD/USDT
Elrond (EGLD) bounced off the 50-day SMA ($181) but could not clear the overhead hurdle at $245.80. This suggests that bulls are buying on dips while bears are selling on rallies.
EGLD/USDT daily chart. Source: TradingView
The 20-day EMA ($220) has flattened out and the RSI is just above the midpoint, indicating a balance between supply and demand.
The buyers are attempting to sustain the EGLD/USDT pair above the 20-day EMA. If they manage to do that, the bulls will again try to push the pair above $245.80. If they manage to do that, the pair could rally to $303.03.
On the contrary, if bears pull the price down from the current level, a retest of the 50-day SMA is possible. A break and close below this support could open the doors for a further decline to the 100-day SMA ($132).
EGLD/USDT 4-hour chart. Source: TradingView
The pair has bounced off the uptrend line, which suggests that traders are buying on dips. The bulls will now try to propel and sustain the price above the downtrend line. If they succeed, the pair may resume its up-move and rally to $277.88 and then to $303.03.
Contrary to this assumption, if the price turns down from the downtrend line, the bears will try to gain an advantage by pulling the price below the uptrend line. Such a move could clear the path for a deeper correction.
The views and opinions expressed here are solely those of the author and do not necessarily reflect the views of Cointelegraph. Every investment and trading move involves risk, you should conduct your own research when making a decision.
Bitcoin (BTC) is knocking at the doors of the key $50,000 level and most traders are still optimistic even after the digital asset rallied 70% from the July 20 low at $29,278 to an intraday high at $49,757.04 on Aug. 21.
Monitoring resource Material Indicators pointed to a lot of puts at the $50,000 strike price and the “positive funding almost across the board (overheated),” which suggests a rejection at the current levels and a “pullback going into September.”
Crypto market data daily view. Source:Coin360
Nikita Ovchinnik, chief business development officer of 1inch Network said that several new institutional investors had taken exposure to crypto in the past year, and that “they didn’t come for short-term gains.”
Another positive sign for the crypto sector is the ever-growing list of unicorns. Analysts expect more companies to join the list as the adoption of crypto and blockchain increases.
Bitcoin’s hesitation near the $50,000 mark may shift focus to altcoins? Let’s study the charts of the top-5 cryptocurrencies that are likely to attract traders’ attention in the short term.
BTC/USDT
Bitcoin rebounded off the 20-day exponential moving average ($45,049) on Aug. 19 and the bulls pushed the price above the stiff overhead resistance at $48,144 on Aug. 20. The bears are currently attempting to stall the up-move at the psychological resistance at $50,000.
BTC/USDT daily chart. Source: TradingView
If bulls do not give up much ground and flip the $48,144 level to support, it will indicate strength. The BTC/USDT pair could then pick up momentum and start its northward march toward $58,000.
The rising 20-day EMA and the relative strength index (RSI) in the positive zone suggest that the path of least resistance is to the upside.
Alternatively, if bears pull the price below $48,144, the pair could drop to the 200-day simple moving average ($45,816). This is an important level for the bulls to defend because a break below it could embolden the bears.
The sellers will then try to sink the price below the breakout level at $42,451.67. If they succeed, it will suggest the start of a deeper correction.
BTC/USDT 4-hour chart. Source: TradingView
The 4-hour chart shows that the bears are aggressively defending the zone between $49,500 and $50,000. If they can sink the price below the 20-EMA, the pair could drop to $46,600 and then to $44,000.
If that happens, it will suggest that the bulls are losing their grip and the pair could then remain range-bound between $44,000 and $50,000 for a few days. The bears will have to pull the price below $42,451.67 to gain the upper hand.
ADA/USDT
Cardano (ADA) is in a strong uptrend. The bulls pushed the price above the all-time high at $2.47 on Aug. 20 but the long wick on the day’s candlestick showed selling at higher levels. The altcoin formed an inside-day candlestick pattern on Aug. 21, indicating indecision among bulls and bears.
ADA/USDT daily chart. Source: TradingView
The uncertainty resolved to the upside today as the bulls have again pushed the price to a new all-time high. If buyers sustain the price above the breakout level at $2.47, the ADA/USDT pair could rally to $3.
However, the long wick on today’s candlestick suggests that bears are unlikely to give up without a fight. They will try to pull the price back below $2.36 and trap the aggressive bulls. If that happens, the pair may correct to $2.20.
If the price rebounds off $2.20, the bulls will again try to resume the uptrend. A breakout and close above the $2.47 to $2.65 will enhance the prospects of the continuation of the uptrend. Alternatively, a break below $2.20 could pull the price down to $1.94.
ADA/USDT 4-hour chart. Source: TradingView
The 4-hour chart shows the 20-EMA is sloping up but the RSI is forming a negative divergence. This suggests that the bullish momentum may be slowing down. The first sign of weakness will be a break below the 20-EMA.
Contrary to this assumption, if bulls do not give up much ground from the current level, it will suggest strength. That could attract further buying and the pair may then rally to the psychological resistance at $3.
AVAX/USDT
Avalanche (AVAX) rallied from $18.41 on Aug. 17 to $50.27 on Aug. 21, a 173% rally within a short time. This sharp up-move has pushed the RSI above 92, indicating the rally is over-extended in the short term.
AVAX/USDT daily chart. Source: TradingView
The long wick on the Aug. 21 candlestick shows that bears are attempting to defend the psychological resistance at $50. On the downside, the first support is at $40. If the price rebounds off this level, it will suggest that bulls are not booking profits aggressively as they anticipate the rally to continue further.
A breakout and close above $44 could improve the prospects of a retest of the all-time high at $60.30.
On the contrary, if bears pull the price below the 38.2% Fibonacci retracement level at $38.09, the AVAX/USDT pair could correct to the 50% retracement level at $34.34. A break below this support will indicate that the bullish momentum may have weakened.
AVAX/USDT 4-hour chart. Source: TradingView
The 4-hour chart shows that bears are attempting to stall the relief rally at the overhead resistance at $44.60 and the bulls are buying on dips to $40. This suggests that the pair could remain range-bound between these two levels in the short term.
If the bulls drive the price above $44.60, the pair could rally to $50.27. A breakout and close above this level will signal the resumption of the uptrend. Conversely, a break below the 20-EMA will indicate that traders are booking profits and not buying the dips. That could signal the start of a deeper correction.
CAKE/USDT
PancakeSwap (CAKE) is currently in a strong recovery. Sustained buying by the bulls pushed the price above the 38.2% Fibonacci retracement level at $22.74 on Aug. 20.
CAKE/USDT daily chart. Source: TradingView
If bulls sustain the price above $22.74, the relief rally could reach the 50% retracement level at $26.85 and then the 61.8% retracement level at $30.96. The bears are likely to mount a stiff resistance in this zone.
On the way down, the critical support to watch out for is the 20-day EMA ($20.37). If the price rebounds off this support, it will suggest that sentiment remains positive and traders are buying on dips. Conversely, a break below the 20-day EMA could open the doors for a further decline to $16.
CAKE/USDT 4-hour chart. Source: TradingView
The 4-hour chart shows the price is trading inside a rising wedge pattern. If bears sustain the price below the 20-EMA, the pair may drop to the support line of the wedge. This level is likely to act as a strong support and a sharp rebound off it will indicate that traders are buying on dips.
A breakout and close above $24.65 will suggest the resumption of the up-move. The next target objective on the upside is the resistance line of the wedge. The bullish momentum could pick up if bulls thrust the price above the wedge.
Related: Walmart seeks crypto product lead, Dogecoin Foundation returns, Coinbase amasses $4B war chest: Holder’s Digest, Aug. 15-21
ATOM/USD
Cosmos (ATOM) had been trading in a large range between $8.51 and $17.56 since late May. The bulls pushed the price above the resistance of the range on Aug. 18, clearing the path for a possible move to the pattern target at $26.61.
ATOM/USDT daily chart. Source: TradingView
However, the long wick on today’s candlestick and the RSI above 83 suggests the rally is overextended in the short term. This could attract profit-booking by the bulls, resulting in a minor correction or consolidation in the next few days.
If bulls do not give up much ground and flip the $17.56 level into support, the ATOM/USDT pair will again try to resume the uptrend. A break above $26.61 could open the doors for a rally to $28 and then to $30.
The bears will have to pull and sustain the price below $17 to invalidate the bullish sentiment.
ATOM/USDT 4-hour chart. Source: TradingView
The 4-hour chart shows that bears are mounting a stiff resistance near $24. Although bulls had pushed the price above this resistance, they could not sustain the higher levels as seen from the long wick on the candlestick.
A positive sign is that buyers are not dumping their positions in a hurry. The pair could consolidate between $21 and $24 for some time. A breakout and close above $24 will indicate strength and signal the resumption of the up-move.
Alternatively, a break below the 20-EMA will indicate the start of a deeper correction to $17.56.
The views and opinions expressed here are solely those of the author and do not necessarily reflect the views of Cointelegraph. Every investment and trading move involves risk, you should conduct your own research when making a decision.