Decentralized lending platform Aave has launched its permissioned lending and liquidity service Aave Arc to help institutions participate in regulation-compliant decentralized finance.
As opposed to its permissionless cross-chain counterparts on the platform, Aave Arc is a permissioned liquidity pool specifically designed for institutions to maintain regulatory compliance in the decentralized finance (DeFi) space.
The first of 30 entities lined up for the whitelist for Aave Arc was Fireblocks, the institutional digital asset custodian. It explained in a Jan. 5 announcement the pool “enables whitelisted institutions to securely participate in DeFi as liquidity suppliers and borrowers.”
Users of Aave Arc must perform due diligence procedures such as know your customer/ anti-money laundering (KYC/AML) in order to gain access.
Slides from Aave’s first reveal of the permissioned pool in July 2021.
Fireblocks also serves as a whitelisting agent for Aave Arc, ensuring other institutions that wish to join the permission pool perform KYC/AML requirements. Aave cannot perform this task itself because it is not a regulated entity such as a bank or other traditional finance institution.
As the whitelisting agent, Fireblocks has already approved “30 licensed financial institutions to participate on Aave Arc as suppliers, borrowers, and liquidators.”
Among some of the whitelisted entities are Anubi Capital, Canvas Digital, CoinShares, GSR, and crypto yield aggregator Celsius.
Related: SBF ‘optimistic’ about institutional crypto adoption in 2022
Aave’s new permissioned liquidity pool aims to onboard more institutions to the burgeoning DeFi space that has $133 billion in total value locked (TVL) as of time of writing. That TVL has grown 4.5 times since Jan. 10 of 2021 according to DappRadar.
While institutions began purchasing cryptocurrency in increasingly sizable portions in 2021, most remained skittish about dabbling in DeFi due to compliance hurdles and regulatory uncertainty.
Decentralized lending protocol Aave is planning to launch “Aave Pro,” a permissioned platform for institutional investors later this month, according to a new report from Cointelegraph. The platform, which will provide the same kinds of services as Aave’s current platform, will be launched in partnership with the digital asset custody and settlement platform Fireblocks.
The new platform was reportedly announced in a webinar entitled ‘Next Steps in Institutional DeFi’ that featured Stani Kulechov, Michael Shaulov and Mike Novogratz, who are respectively the CEOs of Aave, Fireblocks and Galaxy Digital.
Bank Account Alternative. Business Account IBAN.
Stani Kulechov, CEO of Aave.
According to a screenshot of an email that is said to recap the contents of the webinar, Aave is launching Aave Pro in response to ‘extensive demand from various institutions’. The platform will only support four crypto assets in the beginning: BTC, ETH, AAVE and USDC. Additionally, Aave Pro’s pools will be kept separate from its main platform. Further, the email said that there are plans to eventually decentralized the governance of Aave Pro.
In addition, Aave Pro will add a whitelisting layer onto Aave’s V2 smart contracts to ensure that only ‘institutions, corporates, and fintechs’ approved by Fireblocks’ Know-Your-Customer verification process can access the platform. Moreover, Fireblocks is responsible for Aave Pro’s anti-money laundering and anti-fraud controls.
Aave Pro is slated to vastly expand the total value locked in the Aave ecosystem, which currently sits at around $17 billion.
DeFi “Rails” for Institutional Investors
According to CoinTelegraph, the announcement of the new platform received ‘mixed reactions’ on Twitter. Some enthusiastic users pointed out that the platform will act as a rail for institutions entering the DeFi world in a meaningful way for the first time.
However, others pointed to an ongoing lawsuit against Fireblocks by staking provider StakeHound. The lawsuit was filed over the alleged deletion of private keys to a wallet that contained $72 million in ETH.
Aave first announced that it was entering the institutional world in May, when Kulechov said that Aave had created a “private pool” for institutions to “practice” with before jumping headfirst into DeFi. Furthermore, Aave partnered with Compound in early 2020 to launch DeFi services for institutional investors.
Bitcoin’s (BTC) price continues to be range-bound between $30,000 and $40,000 level for the past few days, which is not necessarily a bearish sign.
Generally, after a sharp fall, the price tends to consolidate as the asset transfers from weaker hands to stronger hands. After the transition is complete, the asset breaks out and starts a new uptrend. Usually, the longer the price consolidates in a range, the stronger the next trending move will be.
Bloomberg Intelligence senior commodity strategist Mike McGlone said on Saturday that Bitcoin’s declining supply was a positive sign, which could act as a “bullish ace” for its move higher “if past patterns hold.”
Crypto market data daily view. Source:Coin360
Yoni Assia, CEO of eToro, also told Cointelegraph that Bitcoin could see a sharp rise “over the next three to five years, as there are still 5 billion people in the world that basically don’t have good local currency.”
Related: Bitcoin price could hit $85K in months as indicators flip bullish — report.
Therefore, investors should not be discouraged by the muted price action in the short term. Bitcoin’s fundamentals remain strong and are likely to result in a new uptrend in the future.
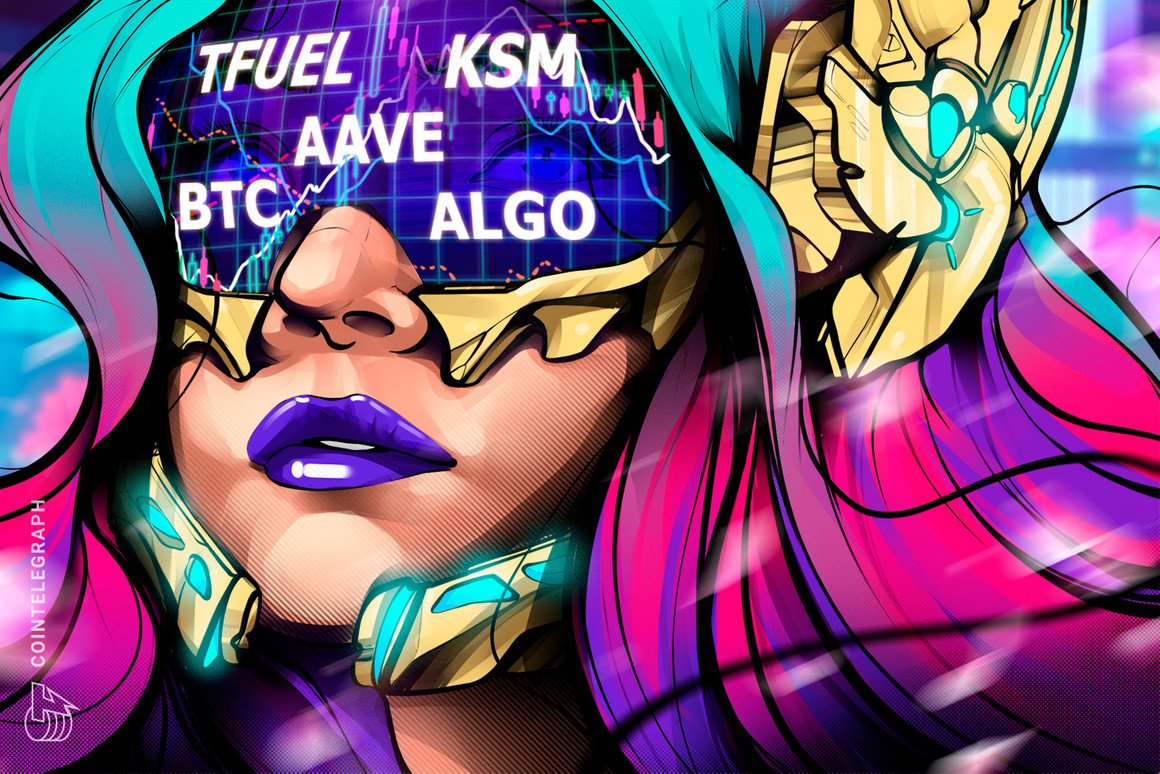
As crypto markets consolidate, let’s analyze the charts of the top-5 cryptocurrencies that may outperform in the next few days.
BTC/USDT
Bitcoin turned down from the resistance line of the descending triangle on Jan. 12 and broke below the 20-day exponential moving average ($36,586). This suggests that the bears are aggressively defending the resistance line.
BTC/USDT daily chart. Source: TradingView
The longer the price stays below the 20-day EMA, the greater the chances of a drop to the lower levels. If bears sink the price below $34,600, the BTC/USDT pair could drop to $33,400 and then to $31,000.
A break and close below $31,000 will complete a descending triangle pattern, which has a target objective at $19,549. However, it is unlikely to be a straight drop to the lower levels because the bulls will attempt to stall the decline in the $31,000 to $28,000 support zone.
This negative view will invalidate if the price continues to move up and rises above the resistance line of the triangle. Such a move could open the gates for a rise to the 50-day simple moving average ($44,709), which is again likely to act as a stiff resistance.
A break above the 50-day SMA will suggest that the correction could be over and the bulls will gradually try to start a new up-move.
BTC/USDT 4-hour chart. Source: TradingView
The moving averages on the 4-hour chart have been crossi each other and the relative strength index (RSI) is just above the midpoint, indicating that bulls are trying to make a comeback.
A breakout and close above the resistance line of the triangle will signal that demand exceeds supply. If the bulls sustain the price above the triangle, a new up-move could begin.
Alternatively, if the price turns down from the resistance line and breaks below $34,000, it could signal a minor advantage to the bears. That could pull the price down to the critical support at $31,000. A bounce off this support will suggest accumulation at lower levels and that could keep the pair inside the triangle for some more time.
AAVE/USDT
Aave is trading inside a large range between $280 and $581.67 for the past few months. The bulls have successfully defended the support of the range on five previous occasions, hence the buyers are likely to buy the dip once again.
AAVE/USDT daily chart. Source: TradingView
If the price rebounds off the current level with strength, it will suggest that the bulls continue to accumulate on dips. The buyers will then try to push the price above the 20-day EMA ($344). If they succeed, the AAVE/USDT pair could rise to the 50-day SMA ($414), which may act as a stiff hurdle.
If the price turns down from the 50-day SMA, the pair could consolidate between $280 and $414 for a few days. On the contrary, a break above the 50-day SMA will clear the path for a northward march toward $581.67.
This positive view will invalidate if the price turns down from the 20-day EMA and breaks below the $280 support. That will embolden the bears who will then try to pull the price down to $208.09 and then to $160.
AAVE/USDT 4-hour chart. Source: TradingView
The 4-hour chart shows the bears had pulled the price below $280 but they are struggling to sustain the lower levels. However, the moving averages are sloping down and the RSI is in the negative zone, indicating advantage to the bears.
If the price turns down from the current level and breaks below $266.68, the pair could start its downward journey. This negative view will invalidate if the bulls push the price above the downtrend line. Such a move will suggest the correction is over and the pair could then rise to $500.
KSM/USDT
Kusama (KSM) has been witnessing volatile moves in the past few days. Although the bulls pushed the price above the $480 overhead resistance on June 9, they could not sustain the higher levels and the price dipped back below the level on June 10. This shows that bears are selling on rallies.
KSM/USDT daily chart. Source: TradingView
However, the buyers have not allowed the price to break below the 20-day EMA ($388). This suggests that the sentiment is turning positive as the bulls are buying the dips to the 20-day EMA.
The rising 20-day EMA and the RSI near the midpoint indicate a minor advantage to the bulls. The buyers will now make one more attempt to push the price above $480. If they succeed, the KSM/USD pair could rally to $537 and then retest the all-time high at 625.
This positive view will invalidate if the price turns down from the current level or the overhead resistance and breaks below $360. That could pull the price down to $280.
KSM/USDT 4-hour chart. Source: TradingView
The 4-hour chart shows the bulls are trying to defend the trendline support. However, the 20-EMA has turned down and the RSI is in the negative zone, indicating the bears have the upper hand.
If the sellers sink the price below $380, the pair could drop to $342. A break below this support could result in a decline to $280.
This negative view will invalidate if the bulls can push the price above $429. That could attract buying, pushing the pair to $480.
ALGO/USDT
Algorand (ALGO) bounced off the trendline on June 12 and rose above the 20-day EMA ($0.97), which suggests the bulls are buying on dips. The flattish 20-day EMA and the RSI near the midpoint suggest the selling pressure has reduced.
ALGO/USDT daily chart. Source: TradingView
The price action of the past few days has formed an ascending triangle pattern, which will complete on a breakout and close above $1.15. If the bulls manage to sustain the price above $1.15, the ALGO/USDT pair could rally to the target objective at $1.63.
Contrary to this assumption, if the price turns down from $1.15, the pair may extend its stay inside the triangle for a few more days. A breakdown and close below the trendline will nullify the bullish view and open the gates for a drop to $0.80 and then $0.67.
ALGO/USDT 4-hour chart. Source: TradingView
The 4-hour chart shows the bulls are attempting to push the price above the downtrend line. If they can sustain the breakout, the pair could rise to $1.15. A breakout and close above this resistance could start a new uptrend.
Conversely, if the price turns down from the current level and breaks below the moving averages, the bears will make one more attempt to sink the price below the trendline. If they succeed, it will signal the start of a deeper correction.
TFUEL/USDT
Theta Fuel (TFUEL) soared to a new all-time high at $0.679 on June 9 but the bulls could not sustain the higher levels as seen from the long wick on the day’s candlestick. That was followed by a sharp pullback to the 20-day EMA ($0.41) on June 12.
TFUEL/USDT daily chart. Source: TradingView
The strong rebound off the 20-day EMA shows the sentiment is positive and traders are aggressively buying on dips. The bulls will now try to push the price to the all-time high where they are likely to encounter stiff resistance from the bears.
If the price turns down from the all-time high, the bears will make one more attempt to pull the price below the 20-day EMA. If they succeed, it will suggest the start of a deeper correction.
Alternatively, if buyers propel the price above the all-time high, the TFUEL/USDT pair could resume the uptrend, with the next target objective at $0.85 and then $1.
TFUEL/USDT 4-hour chart. Source: TradingView
The 4-hour chart shows the pair rebounded strongly off the $0.40 support, which suggests accumulation at lower levels. However, the relief rally is facing resistance just below the 61.8% Fibonacci retracement level at $0.57.
This suggests that the bears have not given up yet and are selling on rallies. If the price dips below the 20-EMA, the bears will try to pull the price down to $0.40. If that happens, the pair may consolidate between these two levels for a few days.
Alternatively, if the price rebounds off the 20-EMA, it will indicate the sentiment is positive and the bulls are not waiting for a deeper fall to buy. That will increase the possibility of a break above $0.57. The pair could then rise to retest the all-time high.
The views and opinions expressed here are solely those of the author and do not necessarily reflect the views of Cointelegraph. Every investment and trading move involves risk, you should conduct your own research when making a decision.
Lorsque vous explorez les différentes options de jeux en ligne, Spin Million Casino se distingue par son offre exceptionnelle de bonus et de promotions. Les joueurs expérimentés apprécieront non seulement la diversité des jeux disponibles, mais également les opportunités de gains qui se présentent à eux. Par exemple, ce casino offre des bonus de bienvenue attractifs qui augmentent considérablement votre capital de jeu dès le départ.
En outre, les options de paris sont variées, allant des machines à sous aux jeux de table en passant par le live casino. Les amateurs de jeux de table trouveront des versions classiques comme le blackjack et la roulette, tandis que les fans de machines à sous pourront profiter de jeux avec des thèmes et des fonctionnalités innovantes. Les jackpots progressifs ajoutent une couche d'excitation supplémentaire, offrant des gains potentiels qui peuvent changer la vie.
Les plateformes de jeu comme Yonibet
Lorsque vous recherchez un casino en ligne fiable, Yonibet est une option à considérer sérieusement. Ce casino a su établir une réputation solide grâce à sa large gamme de jeux, y compris des options de paris sportifs et des machines à sous captivantes. Les bonus offerts sont également un point fort, permettant aux joueurs de maximiser leurs mises et d'explorer de nouveaux jeux sans risque.
De plus, la légalité de ce casino est un autre aspect crucial. Yonibet opère sous une licence respectée, garantissant que toutes les transactions et les jeux sont effectués en toute sécurité. Les joueurs peuvent donc se concentrer sur l'essentiel : profiter de l'expérience de jeu. Les fonctionnalités telles que le live casino permettent une immersion totale, avec des croupiers en direct et une interaction en temps réel qui enrichissent l'expérience.
Roobet Casino : une expérience de jeu unique
Pour ceux qui recherchent une expérience de jeu différente, Roobet Casino offre une plateforme innovante qui attire les joueurs du monde entier. L'interface conviviale et les jeux variés en font un lieu de divertissement idéal pour les parieurs avertis. Les bonus réguliers et les promotions spéciales renforcent l'engagement des joueurs, leur permettant de maximiser leur expérience.
Les options de paris sont étendues, avec une section de paris sportifs bien développée qui attire de nombreux passionnés. Les jeux de casino sont également bien représentés, avec des machines à sous excitantes et des jeux de table classiques. L'accent mis sur la sécurité et la légalité est primordial pour Roobet, ce qui permet aux joueurs de profiter de leurs sessions de jeu en toute tranquillité d'esprit.
Cashwin : le choix des joueurs avertis
Enfin, Cashwin se présente comme un choix incontournable pour les joueurs à la recherche de bonus généreux et d'une sélection de jeux de qualité. Avec une interface fluide et des options de paiement variées, ce casino s'efforce de fournir une expérience de jeu optimale. Les promotions régulières et les programmes de fidélité récompensent les joueurs, ajoutant une dimension supplémentaire à leur aventure de jeu.
Cashwin se démarque également par son engagement envers la légalité et la sécurité. Les joueurs peuvent être assurés que leurs informations personnelles et financières sont protégées. Que ce soit pour des paris sportifs ou des jeux de casino, Cashwin offre un environnement sécurisé où l'amusement et le potentiel de gains sont au rendez-vous.