Bitcoin is correcting losses and trading above $39,000 against the US Dollar. BTC could gain bullish momentum if it clears the $40,000 resistance zone.
Bitcoin is slowly recovering and trading above the $39,000 zone.
The price is trading above $39,200 and the 100 hourly simple moving average.
There was a break above a major bearish trend line with resistance near $38,980 on the hourly chart of the BTC/USD pair (data feed from Kraken).
The pair might accelerate higher and could even surpass the $40,000 resistance zone.
Bitcoin Price Starts Correction
Bitcoin price extended decline below the $38,000 support zone. However, BTC found support near the $37,150 zone and started a decent recovery wave.
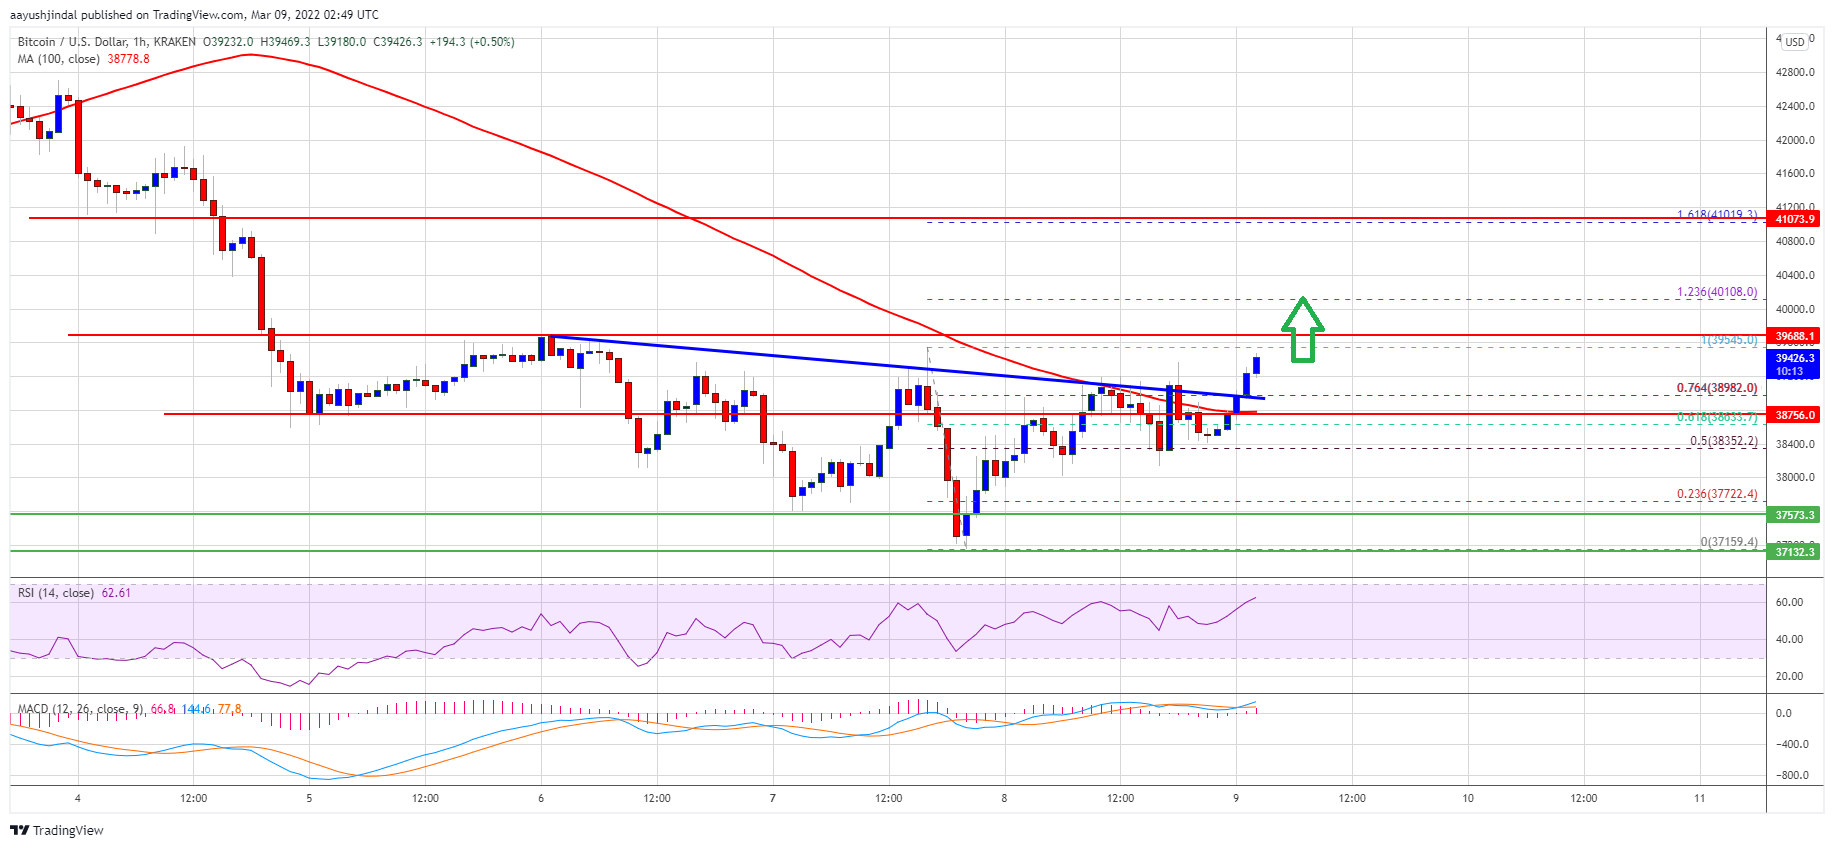
A low was formed near $37,159 before the price corrected higher. There was a move above the $38,000 and $38,500 resistance levels. The price was able to climb above the 76.4% Fib retracement level of the downward move from the $39,545 swing high to $37,159 low.
Besides, there was a break above a major bearish trend line with resistance near $38,980 on the hourly chart of the BTC/USD pair. Bitcoin is now trading above $39,200 and the 100 hourly simple moving average.
On the upside, an immediate resistance is near the $39,545 swing high. The next major resistance is near the $40,000 level. If there is a clear move above the $40,000 resistance zone, the price might accelerate higher. In the stated case, the price could rise towards the $41,000 zone.
Source: BTCUSD on TradingView.com
The 1.618 Fib extension level of the downward move from the $39,545 swing high to $37,159 low is also near the $41,000 level. Any more gains might send the price towards the $42,200 level.
Another Rejection in BTC?
If bitcoin fails to clear the $40,000 resistance zone, it could start another decline. An immediate support on the downside is near the $39,150 zone.
The next major support is seen near the $38,800 level and the 100 hourly simple moving average. If there is a downside break below the $38,800 support, the price might gain bearish momentum. In the stated case, there is a risk of a move towards the $37,500 level.
Technical indicators:
Hourly MACD – The MACD is now gaining pace in the bullish zone.
Hourly RSI (Relative Strength Index) – The RSI for BTC/USD is now above the 50 level.
Major Support Levels – $39,150, followed by $38,800.
Major Resistance Levels – $39,545, $40,000 and $41,000.
Bitcoin continues to trend lower over the weekend and seems at risk of re-testing previous lows. The first crypto by market cap was rejected at mid-area north of $40,000 and was unable to muster the momentum to hold those levels.
Related Reading | Did Top Three Bitcoin Addresses Just Call Another Local Bottom?
As of press time, Bitcoin trades at $39,921 with a 1.2% and 5.2% loss in the last day and 7 days, respectively.
BTC trends to the downside on the daily chart. Source: BTCUSD Tradingview
Yuya Hasegawa, analyst for Bitbank, attributes BTC’s price recent price action to the Russia-Ukraine situation. In that sense, the analyst expects potential relief as the U.S. Secretary of State Antony Blinken and the Russian Minister of Foreign Affairs Sergey Lavrov scheduled a phone call for next week.
This could tone down the tensions around the situation at the border. On top of that, the analyst claims Bitcoin is sitting at “ample technical support” which could protect its price from further downside.
However, is a long weekend in the U.S. which usually leads to potential periods of high volatility driven by low trading volumes across the crypto market. Hasegawa said talking about BTC’s price immediate and medium-term potential headwinds:
We still have the January U.S. PCE, February jobs report, and CPI until the March FOMC meeting, so it is safe to say that, depending especially on these inflation data, the worst may be still ahead of us, and even if the price rebounds from the current level in the short term, upside is likely quite limited unless the Russian military shows some signs of retreating.
The macro-situation seems to occupy everyone’s attention. A separate analyst from Material Indicators (MI) claims the Russia-Ukraine situation could see an outcome after the Winter Olympics in Beijing. These events have been linked to similar crises in the past, such as the invasion of Crimea which took place in 2014 during the Olympics hosted by Russia.
Bitcoin To See Short Squeeze Over Long Weekend?
Further data provided by Material Indicators claims BTC could have entered a distribution phase. Recommending traders to “avoid knife catching”, especially during periods of low volume, MI presented their Trend Precognition indicator which flashed a bearish arrow on the daily chart as BTC’s price trend below $40,000.
Material Indicator’s Trend Precognition Indicator flashed a bearish signal on the daily chart. Source: Material Indicators via Twitter
This could suggest the benchmark crypto might re-test its lows which could find good support, as MI claimed, “in areas of prior consolidation”. The levels between $35,000 to $38,000 were relevant during BTC’s price previous sell-off and could operate as support.
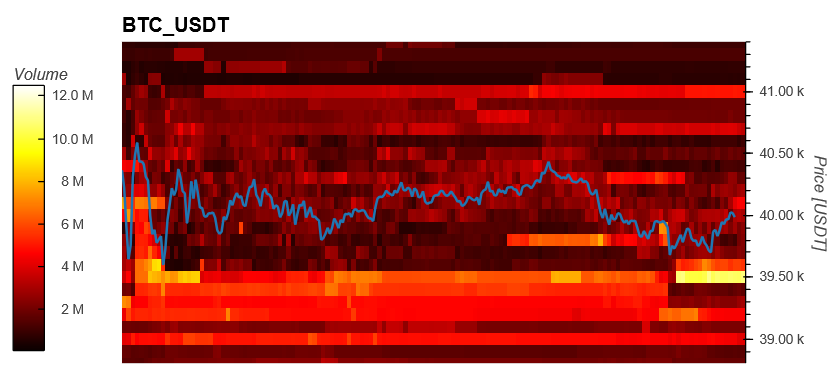
However, MI noted that there are “Liquidity gaps”, levels on the order book with low bids or asks orders, on both sides of the BTC/USDT trading pair. Thus, Bitcoin could see a short squeeze to the upside or downside.
Related Reading |Comparing Apple’s Growth With Bitcoin, Why This Expert Sets $700K As Long-Term Goal
Currently, there are around $10 million in bid order around $39,500. Therefore, there seems to be strong support for BTC at that level which could favor the bulls, at least in the short term.
BTC’s price (blue line on the chart) with potential support on $39,500 due to concentration of bid orders (levels below the price). Source Material Indicators
Data from Cointelegraph Markets Pro and TradingView showed BTC/USD losing $43,000 following the news after hitting local highs above $43,800 on Bitstamp.
With the source of the issue unknown at the time of writing, traders were left in the dark as an already sensitive crypto market fell back towards es
“We are investigating issues with the platform and have to temporarily halt trading,” Bitfinex wrote as part of its latest service update.
We are investigating issues with the platform and have to temporarily halt trading. We will keep everyone updated on here and our status page https://t.co/u3pYCVVGQq as we know more. We apologise for the inconvenience.
Tuesday had seen fellow exchange Binance, the largest by volume in the world, suspend trading for two hours as part of scheduled maintenance, this having no significant impact on BTC price action.
With Thursday already set to be a charged day, however, Bitcoin looked set to close out September almost exactly at its predicted “worst case scenario” price of $43,000.
In so doing, the largest cryptocurrency would once again validate predictions made by stock-to-flow model creator PlanB, who also correctly estimated the August close of $47,000.
Fellow trader and analyst Rekt Capital meanwhile reiterated the need for BTC/USD to reclaim its 21-week exponential moving average level (EMA) by the end of Sunday to preserve overall bullish momentum.
Market mimics $10,000 BTC from September 2020
Meanwhile, the overall character of the Bitcoin market was still far from bearish for most.
Related: Bitcoin breaking new highs in Q4 will ‘temporarily turn alts to dust’ — Analyst
Despite lackluster price action, the odds remain for a dramatic return to form in the coming weeks and months, with comparisons to the same period in 2020.
The latest was from Cole Garner, who noted that the large block of buyer support just below $40,000 was reminiscent of the order book setups when BTC/USD was at $10,000 in September last year.
This week also saw long-time pundit Bobby Lee predict not only $100,000 in the mid term, but as much as $200,000 or more for Bitcoin in a new “FOMO rally.”
Bitcoin price started a strong upward move above the $35,000 resistance against the US Dollar. BTC is showing positive signs and it could rally further above $40,000.
Bitcoin started a strong increase above the $33,000 and $35,000 resistance levels.
The price is now trading well above $35,000 and the 100 hourly simple moving average.
There is a key bullish trend line forming with support near $35,500 with resistance near $31,250 on the hourly chart of the BTC/USD pair (data feed from Kraken).
The pair could correct gains, but the bulls are likely to remain active near $37,000.
Bitcoin Price Surges above $38,000
Bitcoin price found a strong buying interest near the $32,000 zone. BTC formed a support base near the $32,000 and it started a major upward move.
The price surged above the $32,000 and $35,500 resistance levels. There was a clear break above the $38,000 resistance level. The upward move gained strength and the price even traded close to the $40,000 resistance zone.
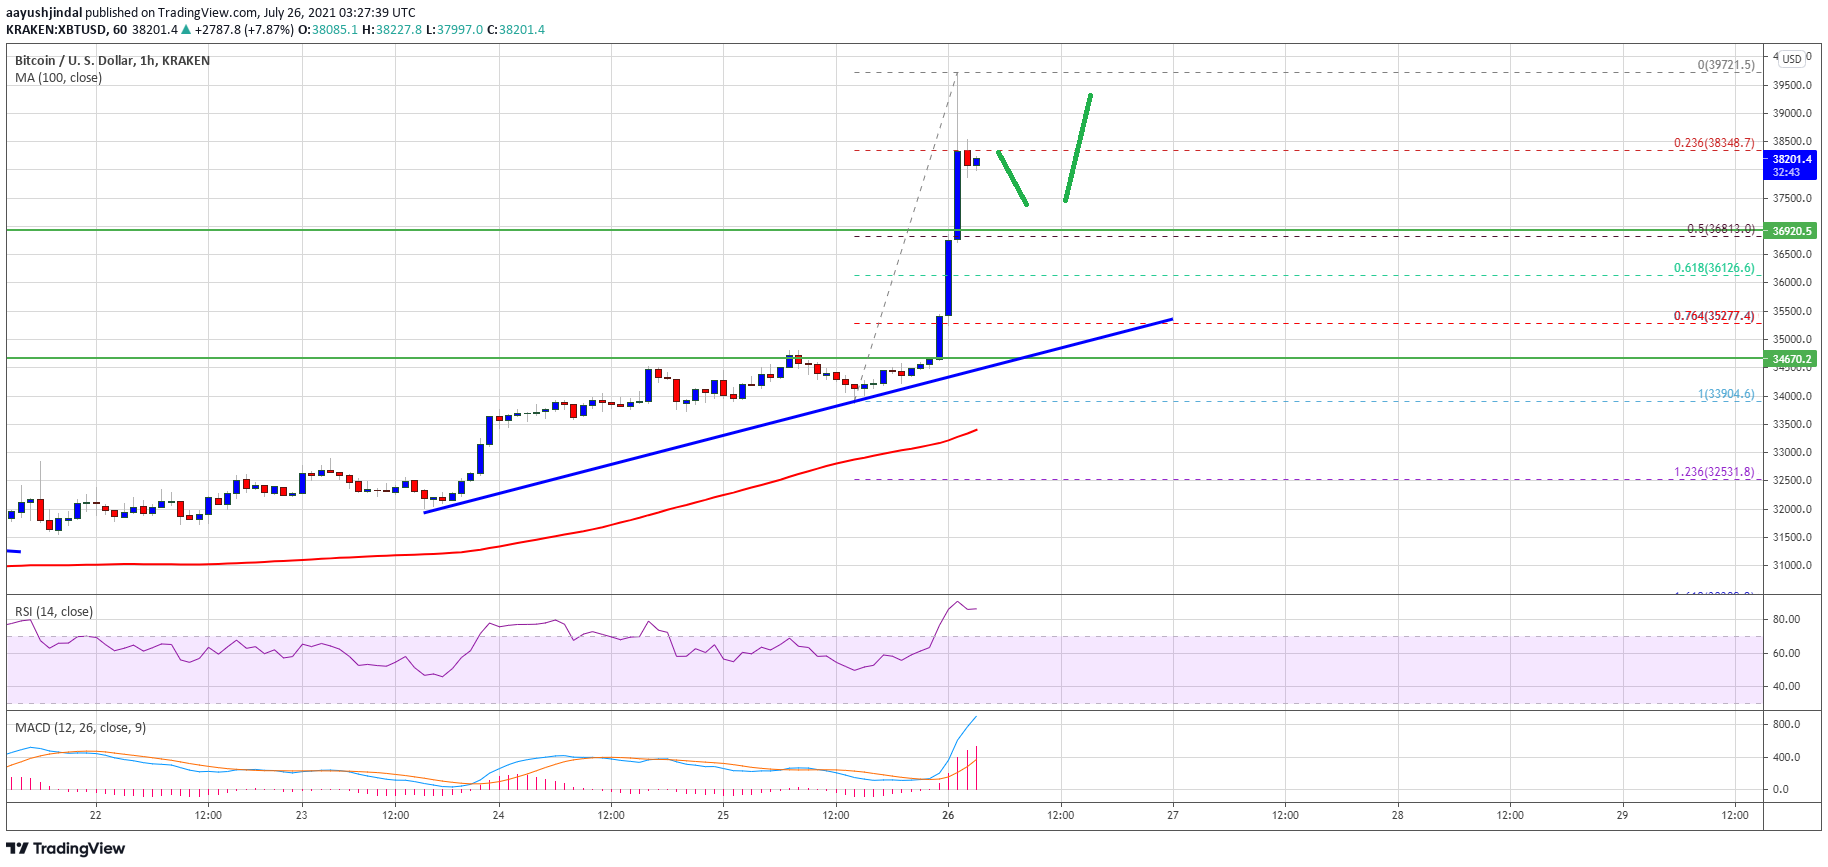
A high was formed near $39,721 and the price is now correcting gains. It is trading near the 23.6% Fib retracement level of the recent rally from the $33,904 swing low to $39,723 high. Bitcoin is now trading well above $35,000 and the 100 hourly simple moving average.
There is also a key bullish trend line forming with support near $35,500 with resistance near $31,250 on the hourly chart of the BTC/USD pair. It is showing a lot of positive signs near the $38,000 level. On the upside, an initial resistance is near the $39,000 level.
Source: BTCUSD on TradingView.com
The first major resistance is near the $39,500 level. The main resistance sits near $40,000. A successful break and close above the $40,000 level could initiate a fresh rally in the near term. In the stated case, the price is likely to move towards the $42,500 level in the near term.
Dip Supported in BTC?
If bitcoin fails to climb above the $39,500 and $40,000 resistance levels, it could start a downside correction. An initial support on the downside is near the $37,500 level.
The first major support is now near the $36,800 zone. A clear downside break below the $36,800 support may possibly push the price towards the $36,000 support zone in the near term.
Technical indicators:
Hourly MACD – The MACD is now losing pace in the bullish zone.
Hourly RSI (Relative Strength Index) – The RSI for BTC/USD is now well in the overbought zone.
Major Support Levels – $37,500, followed by $36,800.
Major Resistance Levels – $39,000, $39,500 and $40,000.
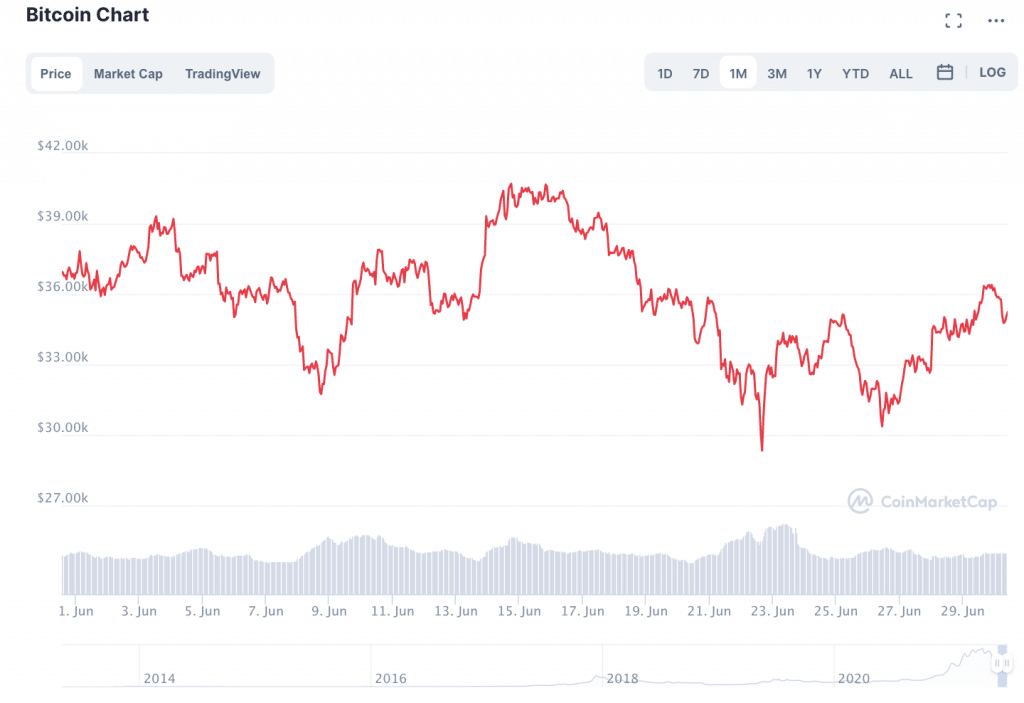
As the month of June draws to a close, Bitcoin is continuing to trade within the $30K – $40K range for the fourth week in a row.
Justin Hartzman, Chief Executive of Canadian cryptocurrency trading platform, CoinSmart.
Bank Account Alternative. Business Account IBAN.
Justin Hartzman, Chief Executive of Canadian cryptocurrency trading platform, CoinSmart, told Finance Magnates that: “It’s no secret that the crypto market has more or less been moving along sluggishly.”
Indeed, BTC still does not seem to have enough momentum to make strong moves one way or the other. While BTC briefly dropped below $30K earlier this month, a move that many feared would lead to further drops, it quickly recovered to levels just over $30K.
“During this recent surge, the Bitcoin price managed to flip the 20-day simple moving average from resistance to support,” Hartzman explained. “This is crucial as the bulls have gained a strong support wall which could prevent a further fall.”
On the other hand, BTC does not seem to have enough support to break through the other side of the $30K – $30K range, either. “The Bitcoin price faces a major resistance wall between $36,500 – $38,500.”
Was Bitcoin Oversold in May?
According to IntoTheBlock’s IOMAP metric, “around 1.65 million addresses had purchased ~850,000 BTC tokens at this level,” Hartzman explained. IOMAP, which stands for “Out of the Money Around Current Price,” identifies the ten most relevant clusters of investor positions at a range of +-15% of Bitcoin’s price at any given moment.
Doug Schwenk, Chairman and Chief Executive of Digital Assets Research (DAR).
“It’s likely true that BTC’s price was overly-impacted by some negative news events in the past weeks.”
“If the buyers somehow flip this wall from resistance to support, $40,000 is definitely within reach,” he continued. “It depends on the appetite for long-term investors in further accumulation of BTC during this market phase.”
Doug Schwenk, Chairman of Digital Asset Research (DAR), added that Bitcoin’s price movement has “been very positive over the past couple of days, and could continue upward.”
“BTC trades largely on sentiment, and if that continues to be positive in the coming hours and days, we could easily see BTC trade above $40k. It’s likely true that BTC’s price was overly-impacted by some negative news events in the past weeks which has seen it trade lower than anticipated.” Indeed, the government of China has been cracking down on cryptocurrency mining, leading to some uncertainty in Bitcoin markets. However, some analysts believe that this crackdown will not hinder BTC’s growth in the long term.
Banning Bitcoin mining makes the network more resilient.
Future generations will look at this time and it’ll be obvious that a decentralised monetary network at scale is more resilient than a nation state acting against it. https://t.co/8pTe4snjpZ
Exchanging Gift Cards to Crypto, Bitcoin’s Adoption Going MainstreamGo to article >>
Of course, “It’s always at risk of falling further, especially as an asset that trades on sentiment and doesn’t yet have a strong economic use case.” However, BTC’s recent sell-off “has been perceived as over done, which likely brings buyers back into the market. Only time will tell if that view will turn into action.”
Leverage Has Been Purged from Bitcoin, Possibly Promoting Healthier BTC Growth
This prolonged period of relative stagnancy in the price of Bitcoin seems to reflect the possibility that much of the leverage that propped the Bitcoin price up earlier this year has been purged from the market.
Indeed, the elimination of leverage from Bitcoin was cited as the reason for BTC’s price crash in May. Over the course of the month, the price of BTC dropped from $58,000 to $34,000; at its lowest point, the price of Bitcoin was nearly $32K.
Tom Howard, Head of Business Development & Growth at PowerTrade, told Finance Magnates that: “Funding rates appear to have stabilized near zero or slightly negative, which indicates the overexposed bulls have rinsed out and bears are being cautious.”
“Realized volatility has fallen, indicating that over-leveraged positions have been closed out, and that market strength is building.”
Tom Howard, Head of Business Development & Growth at PowerTrade.
Indeed, while leverage seems to have been the driving force that drove the price of Bitcoin to unprecedented heights earlier this year, the market structure was practically wiped away in an instant. A Bitcoin that is overly pumped by leverage has a house built on the sand. Now that leverage has been expelled, BTC may have a shot at building its house on the rock.
In the Short-Term, “De-Levered Markets Get Crushed”
American entrepreneur-turned-crypto enthusiast, Mark Cuban Tweeted about the effects of leveraged trading in the midst of the price drop: “De-Levered Markets get crushed,” he said.
“Doesn’t matter what the asset is. Stocks. Crypto. Debt. Houses. They bring forced liquidations and lower prices. But, crypto has the same problem that HFTs (high-frequency traders) bring to stocks, front-running is legal, as gas fees introduce latency that can be gamed That makes drops drop faster, and gains go up faster,” he said.
While the price drop seemed to foster negative opinions about Bitcoin related to short term price volatility, some analysts believe that the expulsion of leverage from the market is a positive thing for BTC over the long term. Hartzman said that: “this is a good thing, as some semblance of normalcy can now return to the market.”
“There was way too much leverage for market dynamics to remain sustainable over the long-term.”
“Altcoins Are Seeing a Surge That’s Not Necessarily Reflected in Bitcoin Dynamics.”
While Bitcoin may be moving sluggishly, altcoins are seeing much stronger price movements. “Bitcoin is the market leader so it definitely has a major impact on the price movement of altcoins,” Hartzman told Finance Magnates.
“Even so, altcoins are seeing a surge that’s not necessarily reflected in the bitcoin dynamics. There’s been renewed interest in DeFi and many investors are taking the low volatility in BTC prices to revisit the fundamentals of other promising crypto projects.”
Additionally, Schwenk told Finance Magnates that: “We see continued interest in a rotation from BTC into so-called altcoins.”
“Some buyers have been quicker to act on that interest and some are waiting. There is a strong narrative to altcoins as an alternative on several metrics including, ESG and fundamentals. We think, based on client feedback, that this trend will continue over the next year as Ethereum transitions to proof-of-stake and changes happen in the altcoin ecosystem.”
What are your thoughts on Bitcoin’s price movements and their effects on the altcoin market? Let us know in the comments below.