The IOTA Foundation, the non-profit supporting the research and development of new distributed ledger technologies (DLT), including the IOTA Tangle, announced today it been selected to participate in the pre-commercial procurement process for the European Blockchain Services Infrastructure (EBSI), a network of blockchain nodes across the European Union (EU).
Established in 2019 by the European Blockchain Partnership, the EBSI aims to develop a distributed ledger network across the European community to support cross-border services between governments, businesses, and individuals. Its goals are to enhance cross-border mobility, reduce waste of resources, enforce compliance with EU regulations, and encourage the growth of tech hubs and projects. Thanks to EBSI, verified information will flow quickly and reliably Europe-wide.
The EBSI network’s nodes will be run on both by the European Commission and by individual member states. Current and planned use cases include the digital management of educational credentials, the establishment of trusted digital audit trails in notarization, SME financing, data sharing among authorities, and European digital identity. After initial implementation in the EU, the technology will also have the potential to extend beyond the 27 member states.
IOTA is well-positioned to enable EBSI’s vision of secure ledger-based transactions for an EU digital single market. IOTA’s technology fits EBSI’s goals of being scalable, open, decentralized, and interoperable. Permissionless by nature, still IOTA can grant permission to some resources and control data distribution to ensure EU data-sharing compliance. It also supports high throughput and a large number of nodes.
In addition, IOTA’s feeless nature makes micropayments possible and opens up the network to a broad audience. Anyone can afford to use it, whereas the cost of transactions on other blockchains makes notarizing small information exchanges, such as the cost of stamping a single document, prohibitive. IOTA is also energy-efficient and complements the European Green Deal, the EU’s overarching aim of making Europe carbon-neutral by 2050.
“We are very excited about moving forward in the rigorous EBSI procurement process, and we feel great about our chances to play a central role in bringing distributed ledger technology to European administrations. EBSI is an excellent fit, both technologically and ideologically. We do not need to adapt an existing blockchain or to start developing a new solution that fits EBSI’s needs. Our core technology already offers a near-perfect match to the strict requirements and precise specifications for a European ledger infrastructure, and it is ready for widespread adoption with only minimal adjustment.” – Dominik Schiener, Co-Founder & Chairman of the IOTA Foundation
Since 2018, 29 countries (All EU Member States, Norway, and Lichtenstein) and the European Commission have joined forces to form the European Blockchain Partnership (EBP). They have committed to working together towards realizing the potential of blockchain-based services for the benefit of citizens, society, and the economy.
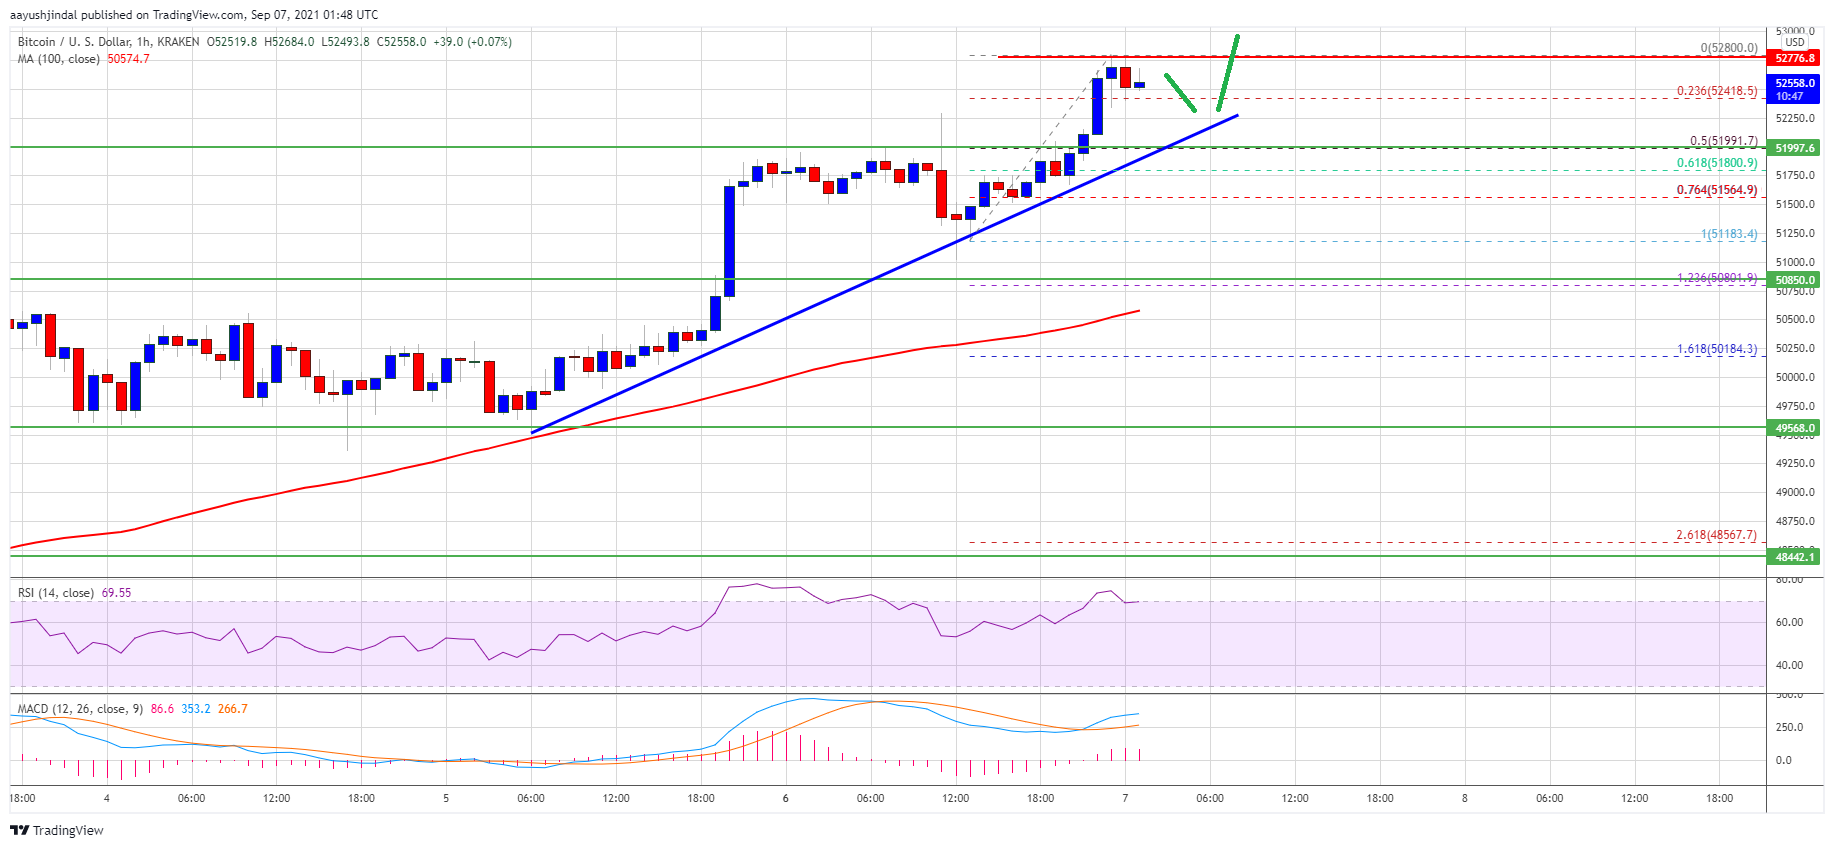
Bitcoin price broke the key $52,000 resistance zone against the US Dollar. BTC remains supported and it could continue to climb higher towards $55,000.
Bitcoin started a fresh increase above the $51,500 and $52,000 resistance levels.
The price is now trading above $52,000 and the 100 hourly simple moving average.
There is a key bullish trend line forming with support near $52,250 on the hourly chart of the BTC/USD pair (data feed from Kraken).
The pair could dips a few points, but it might find support near $52,250 and $52,000.
Bitcoin Price Extends Gains
Bitcoin price consolidated above the $51,000 zone for some time before starting a fresh increase. BTC broke the key $52,000 resistance zone and the 100 hourly simple moving average to move further into a positive zone.
The price even broke the $52,500 resistance and traded as high as $52,800. It is now trading well above $52,000 and the 100 hourly simple moving average. An immediate support is near the $52,400 level. It is near the 23.6% Fib retracement level of the recent increase from the $51,183 swing low to $52,800 high.
The next support could be near the $52,250 level. There is also a key bullish trend line forming with support near $52,250 on the hourly chart of the BTC/USD pair.
Source: BTCUSD on TradingView.com
The main support is now forming near the $52,000 level. It is close to the 50% Fib retracement level of the recent increase from the $51,183 swing low to $52,800 high. If there is a downside break below the $52,000 support zone, the price could extend its decline. In the stated case, the price could test the $50,850 support or the 100 hourly SMA.
More Upsides In BTC?
If bitcoin stays above the $52,000 support zone and the trend line, it could rise further. An immediate resistance on the upside is near the $52,650 level.
The first major resistance is near the $52,800 level. A close above the $52,800 level could pump the price further in the near term. The next major hurdle for the bulls could be near the $53,500 zone. Any more gains could lead the price towards the $54,200 level.
Technical indicators:
Hourly MACD – The MACD is slowly gaining pace in the bullish zone.
Hourly RSI (Relative Strength Index) – The RSI for BTC/USD is well above the 60 level.
Major Support Levels – $52,250, followed by $52,000.
Major Resistance Levels – $56,650, $52,800 and $53,500.
Flirt invest is a platform developed by Brandon West to attract investments in cryptocurrency from anyone who wants to invest their funds in the development of Brandon’s webcam studios network.
Due to the niche specifics, the company cannot enter an IPO and become public by placing its shares, so the company chose cryptocurrency so anyone could invest in it. In addition, Brandon West himself is a crypto enthusiast and a fan of bitcoin.
Let’s figure out how to work with it, how much you can earn and answer the most frequent questions about the platform from our readers.
Registration and work on the platform
1) First, you need to register. For that, you should go to the ‘registration’ tab and create an account.
2) After registration, you will be able to log in to your account. Go to the account settings to put your crypto wallets for receiving payments. You don’t have to put every single one, you can put only the wallet, whose blockchain coins you will be investing.
IMPORTANT: the platform pays out funds exactly in those coins in which you made a deposit. For example: If you have invested BTC, you will receive payments in BTC and will be able to withdraw them to a BTC wallet.
3) Go to the ‘make a deposit’ tab, select the payment system, select the tariff of interest and specify the desired investment amount. Click on the ‘make a deposit’ button.
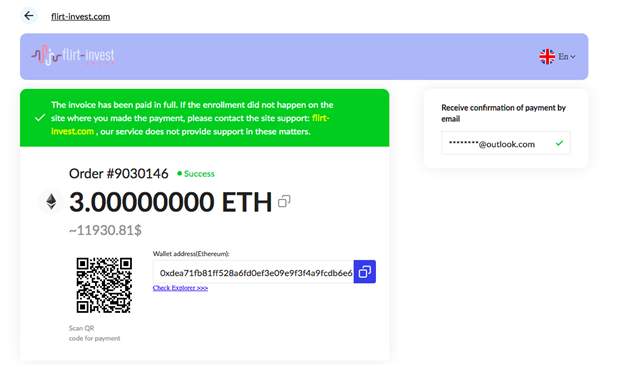
4) After that, you will be redirected to the payment page in the PayKassa merchant. The amount of funds that you’ll need to pay and the wallet for sending the funds will be indicated there. Make sure to send the exact amount that is indicated in the invoice!
5) After receiving 3 confirmations online, you will see that on the invoice payment page. Immediately after that on the Flirt Invest platform, you will see that your deposit has been successfully created. After that, you will be receiving payments every day.
How much will you receive and how much can you earn?
It is important to understand that the initial deposit that you make will be locked for 1 year, but you will be receiving a certain amount every day and will be able to immediately withdraw it or reinvest it back.
It all depends on the amount you are investing. Now the conditions are very favorable, since the company has just started raising funds. Later, the company is planning to reduce the profit for investors. However, the conditions for those who invest now will remain for the whole year.
Let’s figure out how much you can get. The company offers 4 tariffs, with a net profit of 0.5% to 3% per day.
If you invest:
From $100 to $1,000, you will be receiving 0.5% of the invested amount every day. From $1,000 to $10,000, you will be receiving 1% of the invested amount every day. From $10,000 to $50,000, you will be receiving 2% of the invested amount every day. From $50,000 to $250,000, you will be receiving 3% of the invested amount every day.
For example: You invest $12,000 in USDT, that is, 12,000 USDT. That means, that you will be receiving 2% of profit from the initial deposit every day, that is, 240 USDT per day. In 2 months you will earn as much as 14.400 USDT!
You will be able to withdraw a daily payment of 240 USDT immediately or make another deposit and reinvest your profit.
In order to withdraw funds, go to the ‘withdraw funds’ tab, select the payment system, the needed amount and click the ‘withdraw funds’ button. Within a few hours, you will receive a payment to the wallet specified in the account settings.
As you can see, everything is very simple.
In addition to payments from your deposits, you can also participate in the affiliate program and invite your friends or colleagues and receive a bonus of 5% of their deposits. For example: if an invited friend makes a deposit of 1000 USDT, you will receive 50 USDT to your account, which you will also be able to withdraw immediately.
To invite a friend, just send your referral link for registration on the platform to your friend. The link can be found in your personal account.
And now let’s answer the most popular questions:
1) Will the initial deposit be returned after 1 year of freezing? – Yes, after 365 days you will be able to withdraw your initial deposit.
2) Is it possible to exchange coins inside the platform? – No, you strictly get the same coins that you used for the deposit.
3) Are there any restrictions on the amount of deposit? – Yes, one deposit can be made for a maximum amount of $250,000. If you want to invest more, you should make another deposit.
4) Is it possible to make several deposits with different rates? – Yes, the number of deposits is not limited
5) If I invested $500 in the first tariff, and I get 0.5% per day, can I add another $500 and so get 1% from $ 1000? – No, to have 1%, you need to open 1 deposit for $1000 or more. It is not possible to add funds to the current deposit.
6) What are the guarantees that my funds will not be lost? – The rules of the site indicate that the company is fully responsible for the safety of investors’ funds. Flirt Invest also has an authorized capital of 1,000,000 pounds to insure the deposits of its customers.
7) Are there any restrictions on the number of invited friends? – No, the more you invite, the more you will earn. For bloggers, website owners and people with a large audience, the company offers even more favorable terms of the affiliate program.
8) If I have any tech problems with the platform, whom should I contact? – You can write us via the ‘support’ window on the website or send us an email on [email protected]
Conclusions
We hope that after reading this article, you don’t have any questions about the work of the platform. We also hope that you will not miss the chance to take advantage of the current profit percentage that the company offers. As Brandon West mentioned in his recent interview, after receiving the necessary amount, the platform will reduce payments for new investors. After that, the company, according to West, will stop accepting new investors altogether, since it already can develop further due to its own capital.
Buying an asset in a downtrend can be a risky maneuver because most investors struggle to spot reversals and as the trend deepens traders take on deep losses. In instances like these, being able to spot descending channel patterns can help traders avoid buying in a bearish trend.
A “descending channel,” also known as a “bearish price channel” is formed by drawing two downward trendlines, parallel to each other, which confine the price action of the asset.
Descending channel basics
In a downtrend, the price action forms a series of lower highs and lower lows. A descending channel is drawn by joining the lower highs and the lower lows using parallel trendlines. The main trendline is drawn first where two or more lower highs are connected. Then a parallel line, also called the channel line, is drawn connecting the lower lows.
The price action inside a descending channel continues to move south as bears sell on any relief rallies to the main trendline.
Descending channel pattern. Source: TradingView
The asset in the chart above is in a downtrend, forming lower highs and lower lows. The main trendline is drawn by joining two lower highs (marked as ellipses) while the parallel channel line is drawn by joining the two reaction lows.
When the price reaches the channel line, bulls believe that the price has become attractive and they buy, but the bears are in no mood to allow the bulls to have their way. They sell when the price reaches the main trendline and the trend remains down.
The trading inside the channel is usually random but bound between the two parallel lines. A break below the channel indicates that the bearish momentum has picked up and that could result in a spike down.
Conversely, a breakout of the descending channel suggests a possible change in trend. Sometimes these breakouts result in a new uptrend, but on other occasions the price action forms a range before resuming the downtrend.
Descending channel breakouts
THETA/USDT daily chart. Source: TradingView
The chart above shows THETA token in a descending channel where the main trendline is formed by joining the two lower highs made on April 16 and May 9. The parallel line drawn from the reaction low on April 18 forms the channel line.
As seen above, the price action is largely caged between these two lines. The bulls pushed the price above the channel on June 17 but could not sustain the higher levels. The bears again quickly pulled the price back into the channel, trapping the aggressive bulls.
There were a few spikes below the channel line but the long tails on the candlesticks show that bulls used these dips to buy. This shows how the lines act as strong support and resistance.
Finally, the price broke above the channel on July 24 and after a minor consolidation, the recovery continued. This confirmed a legitimate breakout, indicating a possible trend change.
XMR/USDT daily chart. Source: TradingView
Monero (XMR) topped out on June 23, 2019, and then started a downtrend. The main trendline of the channel was formed by connecting the lower highs on July 8, 2019, and Aug. 8, 2019, while the channel line was drawn from the low on July 16, 2019. The XMR/USDT pair continued to trade inside the channel until Jan. 4, 2020.
The bulls pushed and closed the price above the channel on Jan. 5, 2020. This signaled a possible change in trend. The target objective can be arrived at by adding the height of the channel to the breakout level.
In the above case, the depth of the channel was $31.50. Adding this to the breakout level at $51.80, gave a target objective of $83.30. The pair easily exceeded the pattern target and turned down from $96.90 on Feb. 15, 2020.
This suggests that traders should use the target as a guide but decide on closing the position after analyzing other supportive indicators and patterns.
Descending channel breakdowns
LUNA/USDT daily chart. Source: TradingView
Terra’s LUNA token topped out at $22.40 on March 21. Thereafter, it started trading inside a descending channel pattern. The bears pulled the price below the channel line on April 18 but they could not sustain the lower levels. The bulls pushed the price back into the channel on April 23 and trapped the aggressive bears.
The sellers again broke below the channel line on May 19. Attempts by the bulls to push the price back into the channel failed on May 20 and May 21, confirming a valid breakdown. The pattern target of the breakdown was $5.10 and the LUNA/USDT pair bottomed out at $3.91.
Take care to not mix up bull flags and descending channels
BTC/USDT daily chart. Source: TradingView
Bitcoin (BTC) rallied sharply from $17,572.33 on Dec. 11, 2020 to $41,950 on Jan. 8, 2021. Subsequently, the price corrected inside two parallel lines, which was a bullish flag pattern but could have been easily mistaken for a descending channel.
Thomas Bulkowski, author of the book Encyclopedia of Chart Patterns, says when a pattern is less than three weeks long, it is a flag, but longer than that can be considered as a channel.
In the above example, the correction lasted for just over three weeks and the price resumed its up-move after breaking out of the flag.
The views and opinions expressed here are solely those of the author and do not necessarily reflect the views of Cointelegraph.com. Every investment and trading move involves risk, you should conduct your own research when making a decision.
Now that altcoin season is upon us again, multiple tokens are witnessing illustrious price hikes every day. In a sideways market, a key skill for a trader is the ability to anticipate when an asset will break out — and when everything is green, knowing when the rallies are coming to an end becomes equally essential.
This week, CELO embarked on a flash rally that generated an almost vertical line on its price chart, but then it quickly faded without ushering in a strong second wave.
Aside from keeping a steady eye on candlestick charts, was there a better way for traders to know in advance when to hop off?
A new DeFi initiative fuels CELO’s price spike
CELO is the native asset of the Celo blockchain ecosystem, whose main goal is to introduce the convenience of decentralized finance, or DeFi, to underbanked smartphone users around the world. A utility token that utilizes a proof-of-stake consensus mechanism, CELO is designed to facilitate transactions and governance processes on the platform.
On Aug. 30, a consortium of DeFi entities — including Aave, SushiSwap, Curve, 0x, PoolTogether and Celo — announced a joint educational effort aimed at raising global awareness of decentralized finance, to which they pledged up to $100 million in grants and incentives.
In terms of the immediate effect on crypto-asset prices, CELO stood to benefit the most from the news, as the Celo platform will serve as the primary infrastructure for the initiative. The coin’s price soared immediately, gaining some 170% within the next 24 hours.
Extraordinary price spikes like this one often end with hard corrections. However, there is always hope for investors that an even more powerful pump is just around the corner. In CELO’s case, however, the first peak at $9 remained the high-water mark, and the coin’s price only went down from there.
Anticipating a price decline
In addition to being one of the week’s top gainers, CELO is also one of the few assets that recorded a low VORTECS™ Score.
The VORTECS™ Score is a machine learning algorithm that compares historic and current market conditions around digital assets to aid crypto traders’ decision-making. Available exclusively to Cointelegraph Markets Pro subscribers, the indicator considers a host of variables — including price movement, trading volume, social sentiment and market outlook — to arrive at a score that assesses whether the present conditions for a given coin are historically bullish, neutral or bearish.
High scores indicate the model’s confidence that the conditions currently observed are historically favorable; low scores, which occur less frequently, appear when the algorithm sees a pattern that in the past consistently preceded significant price drops.
CELO price vs VORTECS™Score. Source: Cointelegraph Markets Pro
As visible in the above graph, CELO’s VORTECS™ Score dipped into the red zone below 30 when the asset’s price briefly recovered from $7.03 to $7.24 on its way down from the peak value of $9. While this bounce could look like the beginning of the rally’s second leg, historical precedent suggested that the conditions around the coin were bearish.
Traders could use this insight in several ways. Those who had hoped for the price to soar again could be nudged to abandon these hopes and lock in their profits above $7. Another strategy could be to short CELO, wagering that its price would soon return to a downward slope.
As for CELO, the asset soon stabilized in the range between $5.50 and $6, which still represented considerable growth from the $4.30 region from which it exploded during the initial rally.
Cointelegraph is a publisher of financial information, not an investment adviser. We do not provide personalized or individualized investment advice. Cryptocurrencies are volatile investments and carry significant risk including the risk of permanent and total loss. Past performance is not indicative of future results. Figures and charts are correct at the time of writing or as otherwise specified. Live-tested strategies are not recommendations. Consult your financial advisor before making financial decisions.
Manila, Philippines, September 3, 2021 — Southeast Asian based RFOX Games (a subsidiary of RedFOX Labs $RFOX) will release its free-to-play play-to-earn game KOGs SLAM! in closed beta this Friday the 3rd of September and welcome YGG (Yield Guild Games) to the beta release.
RFOX Games’ maiden release KOGs SLAM! is a digital gaming experience inspired by the 90’s schoolyard phenomenon POGs. RFOX Games will introduce a free play-to-earn model to millions of users in the Southeast Asian region.
RFOX Games, a subsidiary of Southeast Asian venture builder RedFOX Labs, has been working on a game that focuses on digital inclusion and allows people hit hardest by economic challenges an opportunity to earn from their mobile phones.
The closed beta trial for play-to-earn will kick off on September 3 and run for a month before its international public release. The beta release will allow for 5,000 participants to compete for the $RFOX token and prizes and is expected to be heavily oversubscribed.
The easy-to-learn game also has a popular NFT collection called KOGs, which is an acronym for Keys to Other Games. KOGs recently launched its limited Bad Days NFT collection featuring Marvel characters created by Stan Lee. The sale ended last August 28 but you can still buy KOGs here.
Ben Fairbank, CEO, and Co-founder of RedFOX Labs commented:
“It is highly likely that this game could reach millions of users across Southeast Asia and beyond when you consider that a free play-to-earn model would be welcomed with open arms by those most impacted by COVID, with many having lost their jobs.”
“We had an ambitious plan and model, and we are finally ready to go to the closed beta for the play-to-earn. We are thrilled to welcome YGG and Real Deal to the trial who can help us gain exposure to a wider audience of play-to-earn gamers. We are thrilled to have organizations of this caliber join the trial.”
Gabby Dizon, Co-founder of Yield Guild Games commented:
“We’re happy to be working with RFOX GAMES to bring YGG members into the KOGS SLAM closed beta. This gives an opportunity for our underserved members to start earning while they move up our scholarship waitlist. Being able to start playing for free and move earnings directly to GCash will massively increase play-to-earn adoption in the Philippines.”
Register here for the closed beta and early releases.
RedFOX Labs will also feature the KOGs collection and games in its upcoming metaverse the RFOX VALT
About RFOX Games
RFOX Games, launched by RedFOX Labs, Southeast Asia’s first blockchain venture builder. RFOX Games is building a series of interoperable games that are PLAY TO EARN and support the KOGs NFT collection. The entire RFOX ecosystem is supported by its native currency $RFOX and users will be able to compete in head-to-head and tournament-based games to win NFT prizes and $RFOX.
About Yield Guild Games
Yield Guild Games (YGG) is a decentralized autonomous organization (DAO) for investing in non-fungible tokens (NFTs) used in virtual worlds and blockchain-based games. The organization’s mission is to create the biggest virtual world economy, optimizing its community-owned assets for maximum utility and sharing its profits with its token holders.
Steven Ehrlich, director of research for digital assets at Forbes, discusses the FTX.US-LedgerX merger, what to expect from FTX going forward, DeFi regulation, and more. Show highlights:
why the FTX.US acquisition of derivatives platform LedgerX is significant
how FTX.US stacks up against other US cryptocurrency exchanges
who should use crypto derivative products
how regulators might handle FTX.US and crypto derivative ETFs
what to expect from FTX going forward
how long FTX CEO Sam Bankman-Fried spends talking to regulators every day
why Steven thinks crypto mergers and acquisitions will be a trend going forward
what Steven learned from his conversations with Polygon and Hermez
how Fereshteh Forough, a woman living in Afghanistan, is using crypto to help teach women to build dapps, smart contracts, and use crypto
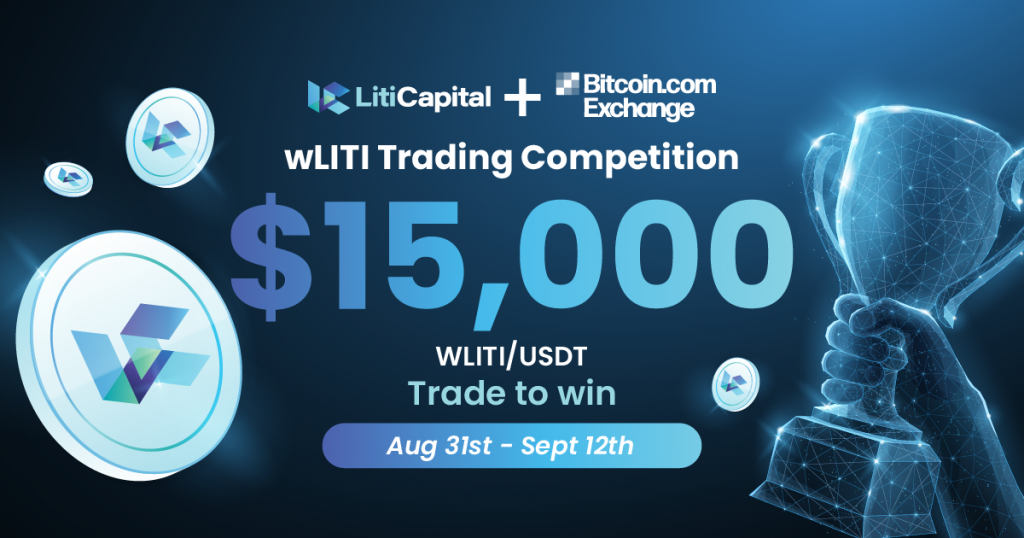
To celebrate the listing of wLITI on Bitcoin.com Exchange, apply to win a piece of a $15,000 prize pool!
The top X Traders with the highest trading volume will be sharing the prize pool. The competition starts on August 31st at 0:01 UTC and runs until September 12th at 23:59 UTC.
You can join by simply going to our competition page, clicking the apply now button, and registering for it. Your trading volume will then automatically be tallied.
GO TO COMPETITION PAGE
Prizes will be awarded in the following manner:
1. $1,950 wLITI
2. $1,000 wLITI
3. $950 wLITI
4. $850 wLITI
5. $750 wLITI
6. $700 wLITI
7. $600 wLITI
8. $550 wLITI
9. $500 wLITI
10. $450 wLITI
11. $400 wLITI
12. $350 wLITI
13. $300 wLITI
14. — 24. $250 wLITI
25. — 30. $200 wLITI
31. — 32. $150 wLITI
33. — 42. $100 wLITI
43. — 50. $50 wLITI
Terms and conditions apply.
About wLITI and LITI Capital
wLITI is the wrapped version of Liti Capitals equity token: LITI. Liti Capital is a Swiss Fintech company that provides an all-in-one platform for litigation finance. Through litigation, finance plaintiffs who lack financial resources to make their claims can gain access to financing. At the same time, the platform enables investors to earn returns independent of the macroeconomic climate.
Terms and conditions apply.
“Trading Volume” is defined as the sum of a trader’s total buys and sells (excluding wash trades) of wLITI/USDT trading pairs on Bitcoin.com Exchange. We calculate Trading Volume in the following way: Trading Volume = Sum (executed buys of wLITI/USDT pair ) + Sum (executed sells of wLITI/USDT pair).
Winning traders will be notified by email and rewards will be deposited to their Bitcoin.com Exchange wLITI wallets within 3 weeks after the end of the promotion period.
The trading competition runs for days from Friday, August 27th at 00:01 UTC until Friday, September 10th, 23:59 UTC.
Participation in the $15,000 wLITI Trading Competition is limited to one trader account per legal or natural person. Persons found to have competed with more than one trader account will be disqualified from the competition.
Please note in the event of disqualification of any participants due to a breach of the terms and conditions of the trading competition, the leaderboard ranking might not be adjusted.
Bitcoin.com Exchange will use the ad hoc average daily closing prices of the wLITI/USDT trading pair during the competition period as the wLITI/USDT exchange rate for wLITI distribution. For an explanation of the calculation of the ad-hoc average daily closing rate, refer to this article.
The $15000 wLITI Trading Competition is hosted by FMFW Ltd (the “Bitcoin.com Exchange”) and the terms and conditions of this competition form part of the User Agreement. The Bitcoin.com Exchange reserves the right to cancel it or amend its terms or conditions unilaterally without prior notification. All existing terms and conditions on the Bitcoin.com Exchange website are applicable to this wLITIst Trading Competition.
By participating you confirm the following: “I accept that performing wash trades and using multiple accounts during one trading competition will lead to my being excluded from the competition. Bitcoin.com Exchanges´s decision is final and binding”.
Melbourne, Australia, Sep 2, 2021 — The world’s first halal decentralized finance (DeFi) ecosystem MRHB DeFi is pleased to announce a strategic partnership with Sheesha Finance, a leading tokenized DeFi mutual fund platform — оnе оf thе hottest рrоjесtѕ in the industry.
A Strategic Alliance, A Shared Vision
The partnership deal with UAE-based Sheesha Finance includes a strategic investment from the DeFi mutual fund to MRHB DeFi for an undisclosed amount. The partnership will also see both parties collaborate alongside mutually beneficial initiatives that align with and promote Islamic Finance business practices. In addition, MRHB DeFi stands to benefit from the premium network and connections of Sheesha Finance.
As an early investor and supporter of MRHB DeFi, Sheesha Finance fully recognizes the vision, ambition and potential of the faith-based DeFi project, as well as its first-mover advantages in the DeFi space.
“As a decentralized fund we’re always on the lookout for like-minded projects and ideas that are looking to advance ethical finance and decentralize finance more. We’re very excited to have partnered with Marhaba, a unique value proposition in DeFi, who are doing that, and a lot more,” says Sheesha Finance CEO, Saeed Al Darmaki.
MRHB DeFi Founder & CEO Naquib Mohammed, echoes the sentiment:
“Sincere thanks to the Sheesha team led by Mr Saeed for this strategic investment and partnership opportunity. We are delighted to have Sheesha Finance as one of our early supporters and partners and are absolutely looking forward to utilizing the team’s crypto and DeFi market expertise and experience.This partnership with Sheesha Finance will open new avenues for growth and expansion for MRHB DeFi across its network.”
Unlocking the Untapped Potential of Ethical and Inclusive DeFi
MRHB DeFi has been developed as an inclusive DeFi ecosystem that allows people of all faiths with an ‘ethics-first’ stance to benefit from the opportunities available in the decentralized digital asset sector.
Complying with the central beliefs governing Islamic finance, MRHB DeFi follows ethical financial and business principles that avoid interest, usury, exploitation and other business practices deemed unethical.
According to the Population Reference Bureau, the total Muslim global population is growing and by 2030, is estimated to increase to 2.2 billion people.
MRHB DeFi is committed to providing exceptional decentralized financial services all within a Shariah-compliant framework, allowing its community to participate in a booming sector while still adhering to the key tenets of their faith.
Strong Backing
Founded by investment and finance expert Saeed Al Darmaki, Sheesha Finance is a decentralized mutual fund that provides investment solutions for crypto portfolio diversification and rewards across the DeFi space, which currently has a total value locked (TVL) of USD 162 billion.
Sheesha Finance has backing across the investment space from Alphabit and Galaxy Digital, led by a team of top cryptocurrency and digital asset experts including David Namdar, a founding partner of Galaxy Digital, and Michael Terpin CEO of Transform Group, among others.
Earlier this year, Sheesha Finance raised USD 9.4 million in investment following a two-week liquidity generation event (LGE).
The Sheesha team has investment partnerships with TeraBlock, Zignaly, Base Protocol, Plasma Finance and Royale Finance, to name a few.
About MRHB DeFi
MRHB DeFi is a halal, decentralised finance platform built to embody the true spirit of an “Ethical and Inclusive DeFi” by following faith-based financial and business principles, where all excluded communities can benefit from the full empowerment potential of DeFi.
Based on the tenets of blockchain such as trust, transparency, and security, MRHB DeFi has encapsulated universally applicable principles of Shariah into those tenets of blockchain to render a suite of offerings. It is a complete DeFi ecosystem whose products, protocols and crypto-assets are governed primarily by the ethical, inclusive, sustainable and charitable investment principles associated with the Islamic faith or ‘Islamic Finance’ (‘IF’ as it is commonly known).
The diverse team is comprised of researchers, technocrats, influencers, Islamic fintech experts & business entrepreneurs, who came together to ensure that MRHB DeFi prevails in a manner that will impact society as a whole, essentially bridging the gap between the faith-conscious communities and the blockchain world.
Read more about MRHB DeFi’s Shariah Concept Paper, Lite and White Paper here.
Sheesha Finance is the leading decentralized DeFi mutual fund allowing for premium cryptocurrency portfolio diversification and rewards. Sheesha Finance rewards investors of any size, from small to large ticket holders, with unlimited DeFi tokens from a diversified portfolio of projects. Sheesha Finance’s easily convertible assets can be freely utilized to maximize rewards and gain exposure to existing and upcoming DeFi projects. With plans to become a member-managed decentralised autonomous organization (DAO), Sheesha Finance is dedicated to upholding full transparency and integrity within the DeFi space.
As decentralized finance (DeFi) garners more traction in the blockchain industry, more projects also get launched into the market. By the end of 2020, the DeFi market size stood at approximately $16 billion. However, within the Q3 2021, the market size has grown to an estimated $154 billion in total value locked.
The exponential market growth is the major reason we have more projects entering the DeFi market. These new projects are not just launching into the market; they are offering solutions to some of the issues in the industry. This is the case of Hashbon FiRe (Finance Reinvented ecosystem) as it enters the DeFi market with its Hashbon Rocket, a decentralized cross-chain token exchange.
The Hashbon Rocket CDEX Platform
Hashbon Finance Reinvented prepares to launch its Hashbon Rocket on September 9, 2021. The Hashbon Rocket CDEX platform is to become the first cross-chain decentralized exchange. This pioneer CDEX platform seeks to solve the problem of exchanging any ERC-20 token for any BEP-20 token in a decentralized finance manner. Unlike the traditional decentralized exchanges that support only intra-chain swaps, Hashbon Rocket CDEX will begin with exchanges between Ethereum and Binance Smart Chain blockchain protocols. The platform will later expand to accommodate other Ethereum Virtual Machine (EVM) compatible networks.
Hashbon Rocket CDEX-platform will use the proof-of-stake (PoS) consensus mechanisms. Here, the arbiters (judges) make decisions, and the power of their share is dependent on their share of HASH tokens. The higher the number of HASH tokens that arbiters have, the higher the reward for a correct response and, conversely, the higher penalty for an incorrect vote. If you want to study the full details of the Hashbon Rocket algorithm, kindly see the project’s whitepaper.
According to the CEO of Hashbon Rocket, Grigory Bibaev, “cross-chain exchange between EVM-compatible blockchains is just the first step. In the future, we see Hashbon Rocket as a multifunctional DeFi platform that provides a variety of services from DeFi bonds for corporations to lending and staking.”
Token for Governing Hashbon Rocket (HASH)
HASH token is a BEP-20 and ERC-20 compliant token and can be tracked on EtherScan and BscScan. It will serve as the utility and governance token for the Hashbon Rocket cross-chain decentralized exchange. It is the fuel that empowers the different system participants. To make exchanges on the Hashbon Rocket CDEX platform, liquidity providers must pay arbiters with HASH tokens. In turn, these arbiters will use the tokens as voting power for verifying and approving transactions. The tokens can also give arbiters the power to submit proposals to Hashbon.
Also, the people wishing to issue DeFi bonds or launch a crowdsale make use of the HASH token. Currently, HASH is available on the Pre-Sale before Rocket’s launch for those who are ready to take advantage of its price and entering this DeFi ecosystem at the earliest stage. Before, HASH was listed on Uniswap, PancakeSwap, BurgerSwap, and also placed on CoinMarketCap and CoinGecko.
Overview of the Hashbon Ecosystem
Hashbon FiRe is a crypto payment ecosystem that was launched in 2016. The vision of the platform has been to bring crypto payments to crypto enthusiasts and day-to-day businesses. As the team seeks a new era of blockchain and decentralized finance development, “Finance Reinvented” (FiRe) became their mission.
In their quest to revolutionize the crypto payment landscape, Hashbon has created a diversified ecosystem that includes the following:
Hashbon Rocket CDEX-platform: Designed for swapping cross-chain tokens.
Hashbon Quant Wallet: Developed for the smooth transfer and receiving cryptos safely.
Hashbon React Payment Gateway: It allows merchants to accept payments in 30+ cryptocurrencies without having to pay any commission.