Ethereum is showing positive signs above $2,500 against the US Dollar. ETH price is likely to accelerate higher above $2,650 and it could revisit $2,800.
Ethereum started a steady increase above the $2,500 resistance and $2,550.
The price is now trading well above $2,500 and the 100 hourly simple moving average.
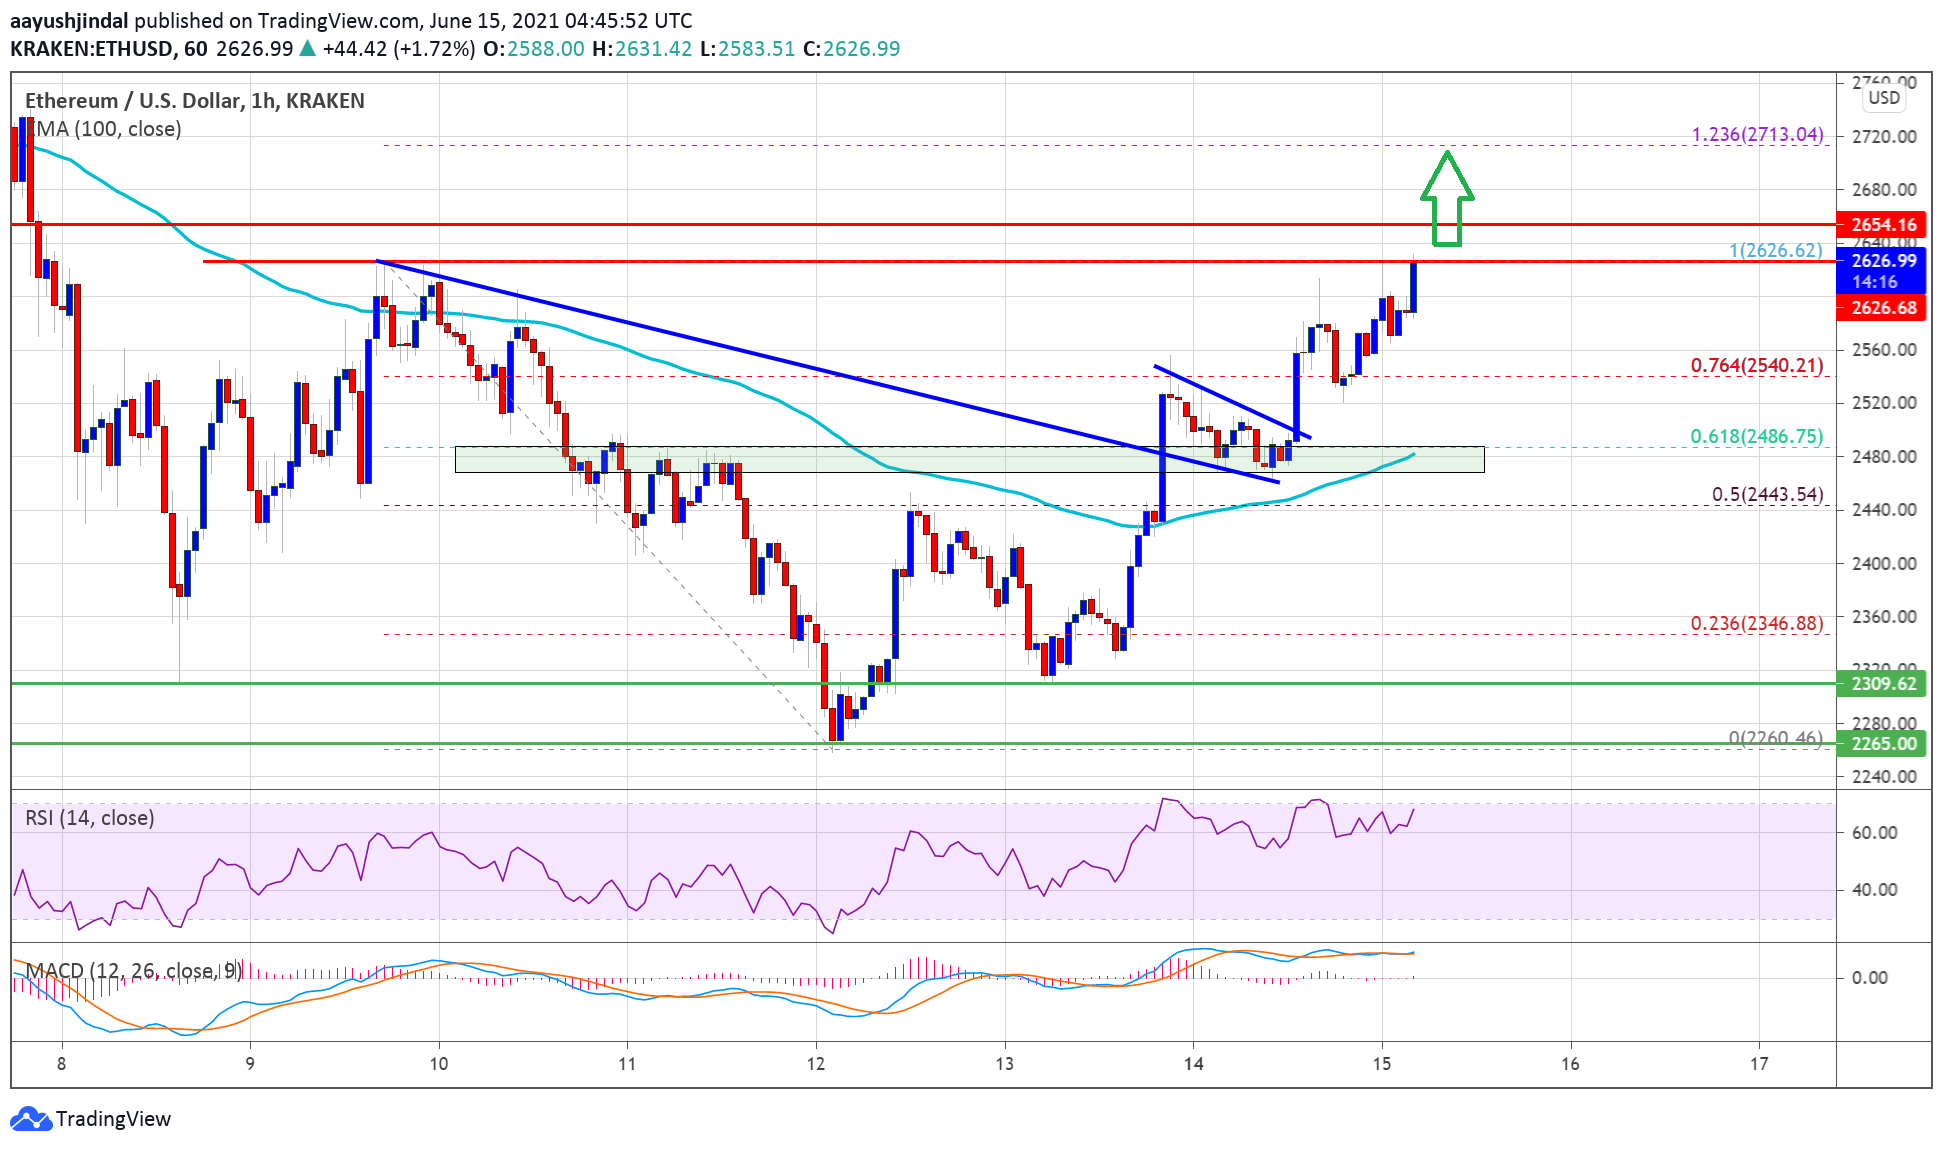
There was a break above a major bearish trend line with resistance near $2,480 on the hourly chart of ETH/USD (data feed via Kraken).
The pair is likely to climb further higher above $2,650 and $2,700 in the near term.
Ethereum Price Gains Bullish Momentum
Ethereum formed a base above the $2,350 level and started a fresh increase. ETH broke the $2,450 resistance zone to move into a bullish zone.
There was a break above a major bearish trend line with resistance near $2,480 on the hourly chart of ETH/USD. The pair even settled nicely above the $2,500 level and the 100 hourly simple moving average. The pair climbed above the $2,550 resistance level.
Ether is now trading well above the 76.4% Fib retracement level of the of the key decline from the $2,626 high to $2,260 swing low. An immediate resistance is near the $2,626 high. A clear upside break above the $2,626 high could set the pace for a larger increase in the coming sessions.
Source: ETHUSD on TradingView.com
The next key resistance is near the $2,715 level. It is near the 1.226 Fib extension level the of the key decline from the $2,626 high to $2,260 swing low. Any more gains above $2,720 could open the doors for a larger increase. The next major barrier for the bulls is near the $2,800 level.
Downsides Limited in ETH?
If Ethereum fails to clear the $2,620 and $2,650 resistance levels, it could start a downside correction. An initial support on the downside is near the $2,580 level.
The first major support is near the $2,550 level. Any more losses could possibly call for a test of the $2,500 support and the 100 hourly SMA in the coming sessions. A downside break below the 100 hourly SMA could push ether price towards the $2,450 support zone.
Technical Indicators
Hourly MACD – The MACD for ETH/USD is now gaining pace in the bullish zone.
Hourly RSI – The RSI for ETH/USD is currently well above the 50 level.
Las Vegas, USA, 10th June 2021— A new gamechanger in the NFT scene, TWO TWO announced its official launch, dropping big names such as Emmy-Award winner Alan Tietel, whose ‘Match and Arrow’ art pieces have been tokenized into NFTs and are up for public auction.
Bitcoin’s (BTC) price continues to be range-bound between $30,000 and $40,000 level for the past few days, which is not necessarily a bearish sign.
Generally, after a sharp fall, the price tends to consolidate as the asset transfers from weaker hands to stronger hands. After the transition is complete, the asset breaks out and starts a new uptrend. Usually, the longer the price consolidates in a range, the stronger the next trending move will be.
Bloomberg Intelligence senior commodity strategist Mike McGlone said on Saturday that Bitcoin’s declining supply was a positive sign, which could act as a “bullish ace” for its move higher “if past patterns hold.”
Crypto market data daily view. Source:Coin360
Yoni Assia, CEO of eToro, also told Cointelegraph that Bitcoin could see a sharp rise “over the next three to five years, as there are still 5 billion people in the world that basically don’t have good local currency.”
Related: Bitcoin price could hit $85K in months as indicators flip bullish — report.
Therefore, investors should not be discouraged by the muted price action in the short term. Bitcoin’s fundamentals remain strong and are likely to result in a new uptrend in the future.
As crypto markets consolidate, let’s analyze the charts of the top-5 cryptocurrencies that may outperform in the next few days.
BTC/USDT
Bitcoin turned down from the resistance line of the descending triangle on Jan. 12 and broke below the 20-day exponential moving average ($36,586). This suggests that the bears are aggressively defending the resistance line.
BTC/USDT daily chart. Source: TradingView
The longer the price stays below the 20-day EMA, the greater the chances of a drop to the lower levels. If bears sink the price below $34,600, the BTC/USDT pair could drop to $33,400 and then to $31,000.
A break and close below $31,000 will complete a descending triangle pattern, which has a target objective at $19,549. However, it is unlikely to be a straight drop to the lower levels because the bulls will attempt to stall the decline in the $31,000 to $28,000 support zone.
This negative view will invalidate if the price continues to move up and rises above the resistance line of the triangle. Such a move could open the gates for a rise to the 50-day simple moving average ($44,709), which is again likely to act as a stiff resistance.
A break above the 50-day SMA will suggest that the correction could be over and the bulls will gradually try to start a new up-move.
BTC/USDT 4-hour chart. Source: TradingView
The moving averages on the 4-hour chart have been crossi each other and the relative strength index (RSI) is just above the midpoint, indicating that bulls are trying to make a comeback.
A breakout and close above the resistance line of the triangle will signal that demand exceeds supply. If the bulls sustain the price above the triangle, a new up-move could begin.
Alternatively, if the price turns down from the resistance line and breaks below $34,000, it could signal a minor advantage to the bears. That could pull the price down to the critical support at $31,000. A bounce off this support will suggest accumulation at lower levels and that could keep the pair inside the triangle for some more time.
AAVE/USDT
Aave is trading inside a large range between $280 and $581.67 for the past few months. The bulls have successfully defended the support of the range on five previous occasions, hence the buyers are likely to buy the dip once again.
AAVE/USDT daily chart. Source: TradingView
If the price rebounds off the current level with strength, it will suggest that the bulls continue to accumulate on dips. The buyers will then try to push the price above the 20-day EMA ($344). If they succeed, the AAVE/USDT pair could rise to the 50-day SMA ($414), which may act as a stiff hurdle.
If the price turns down from the 50-day SMA, the pair could consolidate between $280 and $414 for a few days. On the contrary, a break above the 50-day SMA will clear the path for a northward march toward $581.67.
This positive view will invalidate if the price turns down from the 20-day EMA and breaks below the $280 support. That will embolden the bears who will then try to pull the price down to $208.09 and then to $160.
AAVE/USDT 4-hour chart. Source: TradingView
The 4-hour chart shows the bears had pulled the price below $280 but they are struggling to sustain the lower levels. However, the moving averages are sloping down and the RSI is in the negative zone, indicating advantage to the bears.
If the price turns down from the current level and breaks below $266.68, the pair could start its downward journey. This negative view will invalidate if the bulls push the price above the downtrend line. Such a move will suggest the correction is over and the pair could then rise to $500.
KSM/USDT
Kusama (KSM) has been witnessing volatile moves in the past few days. Although the bulls pushed the price above the $480 overhead resistance on June 9, they could not sustain the higher levels and the price dipped back below the level on June 10. This shows that bears are selling on rallies.
KSM/USDT daily chart. Source: TradingView
However, the buyers have not allowed the price to break below the 20-day EMA ($388). This suggests that the sentiment is turning positive as the bulls are buying the dips to the 20-day EMA.
The rising 20-day EMA and the RSI near the midpoint indicate a minor advantage to the bulls. The buyers will now make one more attempt to push the price above $480. If they succeed, the KSM/USD pair could rally to $537 and then retest the all-time high at 625.
This positive view will invalidate if the price turns down from the current level or the overhead resistance and breaks below $360. That could pull the price down to $280.
KSM/USDT 4-hour chart. Source: TradingView
The 4-hour chart shows the bulls are trying to defend the trendline support. However, the 20-EMA has turned down and the RSI is in the negative zone, indicating the bears have the upper hand.
If the sellers sink the price below $380, the pair could drop to $342. A break below this support could result in a decline to $280.
This negative view will invalidate if the bulls can push the price above $429. That could attract buying, pushing the pair to $480.
ALGO/USDT
Algorand (ALGO) bounced off the trendline on June 12 and rose above the 20-day EMA ($0.97), which suggests the bulls are buying on dips. The flattish 20-day EMA and the RSI near the midpoint suggest the selling pressure has reduced.
ALGO/USDT daily chart. Source: TradingView
The price action of the past few days has formed an ascending triangle pattern, which will complete on a breakout and close above $1.15. If the bulls manage to sustain the price above $1.15, the ALGO/USDT pair could rally to the target objective at $1.63.
Contrary to this assumption, if the price turns down from $1.15, the pair may extend its stay inside the triangle for a few more days. A breakdown and close below the trendline will nullify the bullish view and open the gates for a drop to $0.80 and then $0.67.
ALGO/USDT 4-hour chart. Source: TradingView
The 4-hour chart shows the bulls are attempting to push the price above the downtrend line. If they can sustain the breakout, the pair could rise to $1.15. A breakout and close above this resistance could start a new uptrend.
Conversely, if the price turns down from the current level and breaks below the moving averages, the bears will make one more attempt to sink the price below the trendline. If they succeed, it will signal the start of a deeper correction.
TFUEL/USDT
Theta Fuel (TFUEL) soared to a new all-time high at $0.679 on June 9 but the bulls could not sustain the higher levels as seen from the long wick on the day’s candlestick. That was followed by a sharp pullback to the 20-day EMA ($0.41) on June 12.
TFUEL/USDT daily chart. Source: TradingView
The strong rebound off the 20-day EMA shows the sentiment is positive and traders are aggressively buying on dips. The bulls will now try to push the price to the all-time high where they are likely to encounter stiff resistance from the bears.
If the price turns down from the all-time high, the bears will make one more attempt to pull the price below the 20-day EMA. If they succeed, it will suggest the start of a deeper correction.
Alternatively, if buyers propel the price above the all-time high, the TFUEL/USDT pair could resume the uptrend, with the next target objective at $0.85 and then $1.
TFUEL/USDT 4-hour chart. Source: TradingView
The 4-hour chart shows the pair rebounded strongly off the $0.40 support, which suggests accumulation at lower levels. However, the relief rally is facing resistance just below the 61.8% Fibonacci retracement level at $0.57.
This suggests that the bears have not given up yet and are selling on rallies. If the price dips below the 20-EMA, the bears will try to pull the price down to $0.40. If that happens, the pair may consolidate between these two levels for a few days.
Alternatively, if the price rebounds off the 20-EMA, it will indicate the sentiment is positive and the bulls are not waiting for a deeper fall to buy. That will increase the possibility of a break above $0.57. The pair could then rise to retest the all-time high.
The views and opinions expressed here are solely those of the author and do not necessarily reflect the views of Cointelegraph. Every investment and trading move involves risk, you should conduct your own research when making a decision.
Singapore, 7 June 2021— Vietnam-based RedFOX Labs Joint Stock Company (‘RedFOX’) announces new RFOX Games NFT IP partnership with MarvelousNFTs to present BAD DAYS KOGs Special Edition.
RFOX Games Ups Play-to-Earn with Blockchain
RFOX GAMES is a division of blockchain venture builder, RedFOX Labs, aims to bring a new…
Lorem ipsum dolor sit amet, consectetur adipiscing elit, sed do eiusmod tempor incididunt ut labore et dolore magna aliqua. Eu tincidunt tortor aliquam nulla facilisi cras fermentum odio eu. Viverra orci sagittis eu volutpat odio. Id faucibus nisl tincidunt eget nullam non. Pulvinar neque laoreet suspendisse interdum consectetur libero id faucibus nisl. At varius vel pharetra vel turpis nunc eget lorem dolor. Risus feugiat in ante metus dictum at tempor. Tortor at auctor urna nunc id. Lacus suspendisse faucibus interdum posuere lorem. Rhoncus urna neque viverra justo nec ultrices dui. Ut consequat semper viverra nam libero justo laoreet. Orci sagittis eu volutpat odio facilisis mauris. Tortor aliquam nulla facilisi cras. Porttitor rhoncus dolor purus non enim praesent elementum facilisis.
Ut ornare lectus sit amet est placerat. Pellentesque elit eget gravida cum sociis natoque penatibus et. Elit duis tristique sollicitudin nibh sit amet commodo nulla facilisi. Enim nec dui nunc mattis enim ut tellus. Rhoncus mattis rhoncus urna neque viverra. Suscipit adipiscing bibendum est ultricies integer quis. Ac turpis egestas integer eget aliquet nibh praesent tristique magna. Sit amet risus nullam eget. Placerat in egestas erat imperdiet sed euismod nisi porta. Viverra accumsan in nisl nisi scelerisque eu ultrices. Eget nunc lobortis mattis aliquam faucibus purus.
Aliquet lectus proin nibh nisl condimentum id venenatis a condimentum. Vitae proin sagittis nisl rhoncus mattis rhoncus urna neque. Laoreet suspendisse interdum consectetur libero id faucibus. Ornare lectus sit amet est placerat in. Lacinia quis vel eros donec ac odio tempor. Nunc aliquet bibendum enim facilisis gravida. Eget mauris pharetra et ultrices neque. Mauris cursus mattis molestie a iaculis. Volutpat commodo sed egestas egestas fringilla phasellus faucibus. Faucibus et molestie ac feugiat sed. Mi bibendum neque egestas congue quisque egestas diam in. Amet risus nullam eget felis eget nunc lobortis mattis. A erat nam at lectus urna duis. Ornare quam viverra orci sagittis eu volutpat odio facilisis. Faucibus a pellentesque sit amet porttitor eget dolor morbi. Consequat semper viverra nam libero justo laoreet sit. Sit amet porttitor eget dolor morbi non arcu risus quis. Pretium quam vulputate dignissim suspendisse in est ante in nibh. Ut pharetra sit amet aliquam id.
Enim facilisis gravida neque convallis a cras semper auctor neque. Maecenas ultricies mi eget mauris pharetra et. Tincidunt vitae semper quis lectus nulla. Adipiscing diam donec adipiscing tristique risus nec feugiat in fermentum. Est ullamcorper eget nulla facilisi etiam dignissim. Enim tortor at auctor urna nunc id. Faucibus purus in massa tempor nec feugiat. Scelerisque in dictum non consectetur a erat. Tincidunt nunc pulvinar sapien et ligula ullamcorper. Turpis egestas sed tempus urna et pharetra. Iaculis nunc sed augue lacus. Ut sem viverra aliquet eget sit amet tellus cras. Vitae congue eu consequat ac felis donec et. Elementum nisi quis eleifend quam adipiscing vitae. Massa vitae tortor condimentum lacinia quis vel eros.
Porttitor leo a diam sollicitudin tempor id eu nisl nunc. Neque volutpat ac tincidunt vitae semper quis. Rhoncus est pellentesque elit ullamcorper dignissim cras tincidunt. Sed faucibus turpis in eu mi bibendum neque. Non pulvinar neque laoreet suspendisse interdum. Quis auctor elit sed vulputate mi sit amet mauris commodo. Facilisis magna etiam tempor orci eu. Mauris augue neque gravida in fermentum et sollicitudin ac orci. Cursus eget nunc scelerisque viverra mauris in. Velit euismod in pellentesque massa placerat. Arcu felis bibendum ut tristique et egestas quis ipsum suspendisse. Aliquet enim tortor at auctor urna nunc id. Ante metus dictum at tempor commodo ullamcorper a lacus. Sed faucibus turpis in eu mi bibendum neque egestas congue. Amet consectetur adipiscing elit pellentesque habitant morbi.
MDEX Token (MDX) Enters Top 100 Rankings on Coinmarketcap
Singapore, 27 May 2021 — The leading decentralized cross-chain trading protocol MDEX.COM has pulled off quite the coup, with its MDX token listing on top exchange Binance and its entry into the Top 100 rankings on Coinmarketcap.
In the last 24 hours, the MDX trading volume is USD 87 million and $MDX is currently priced at USD…
Dan Finlay, co-founder of MetaMask, talks about the meteoric growth of monthly active users of the crypto wallet, which has quintupled in the past seven months. In this episode, he discusses:
which crypto use case drove MetaMask’s active user base to grow 5x in under a year
what types of scaling solutions are drawing users to MetaMask
how MetaMask works
what kind of customers are using MetaMask
how MetaMask has grown without targeted marketing
whether the type of crypto usage in developing nations differed from developed nations
which feature MetaMask released in 2020 that is bringing in revenue
what pivotal moments in crypto over the past six years have brought new users to MetaMask
why scalability and security are the most important challenges facing MetaMask in the short term
how MetaMask is trying to make online wallets more secure
how much volume users have traded via MetaMask’s new swap feature
what new features are coming up for MetaMask wallets
Robbie Ferguson, co-founder and president of Immutable, talks about how Immutable is transforming the NFT industry through its layer 2 solution, Immutable X, which just launched April 8. In this episode, he discusses:
what sort of problems Immutable is solving by creating a layer 2 solution (1:21)
why scalability is especially an issue for NFTs in gaming (1:59)
how Immutable X, built with partner Starkware, addresses the problems with scaling NFTs (3:28)
how Immutable is scaling Ethereum and the definition of a layer 2 solution (5:46)
the Immutable business model and how the company makes money (6:40)
how validity proofs like ZK-rollups differ from fraud proofs like Optimistic rollups (7:52)
how Gods Unchained has performed since the April 8th launch of Immutable X (8:27)
why building on Ethereum is so important to Immutable (10:54)
why Immutable is obsessed with bringing liquidity to NFTs (14:54)
what sort of partners Immutable is looking to attract and how Immutable X is different from a traditional marketplace (18:00)
why Immutable decided to purchase carbon credits to offset the gas the protocol consumes on Ethereum (21:33)
what we might see from Gods Unchained, Immutable X, and NFT gaming in general by the end of this year (23:32 )