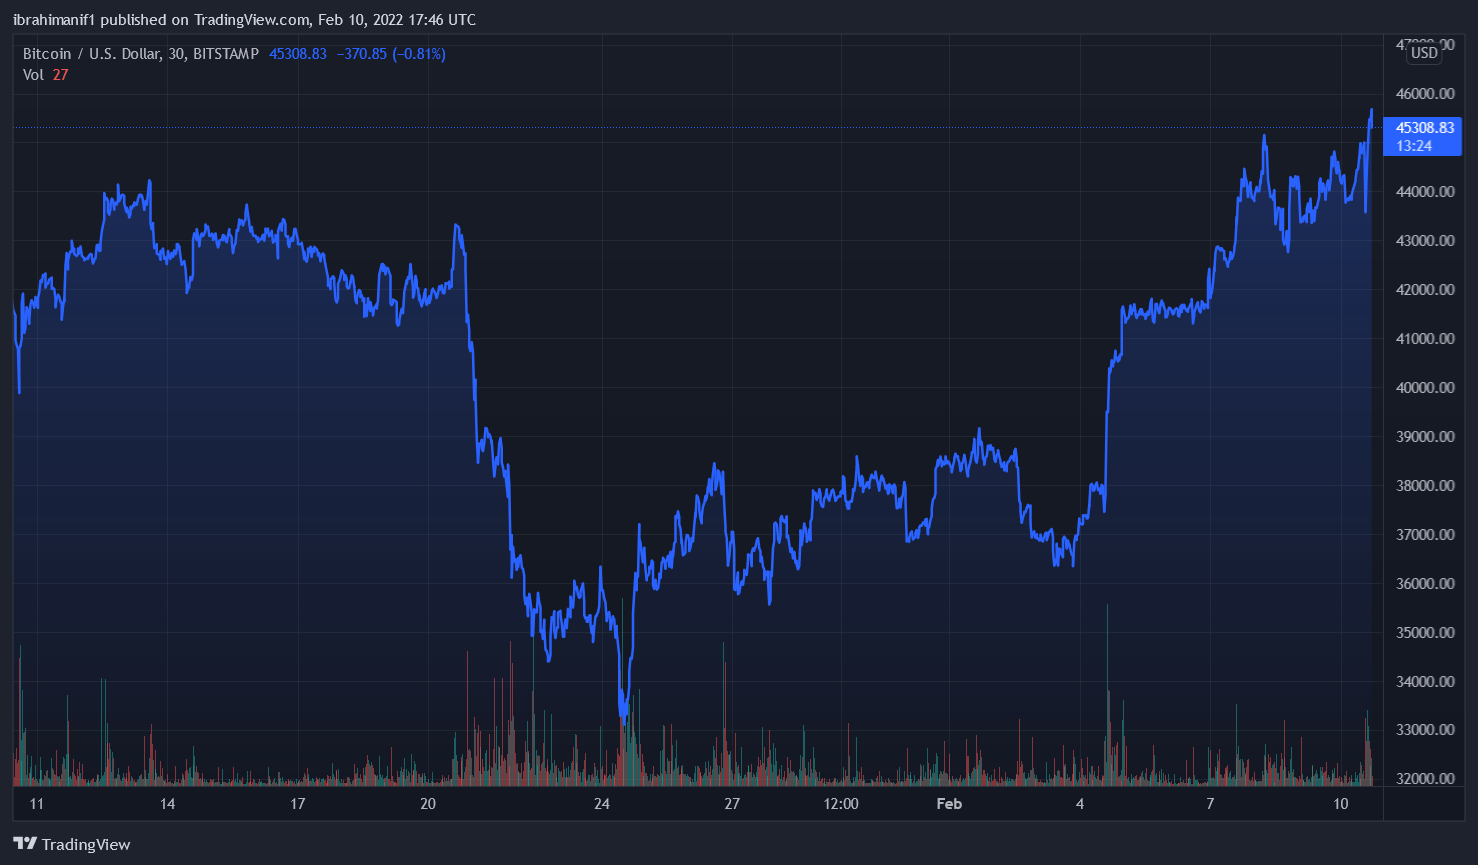
Bitcoin price recovered to within $45k after sliding below $44k as analysts indicated probable swings for the flagship cryptocurrency. The release of US inflation rates seems to have had no effect on the king cryptocurrency.
Bitcoin’s price rose past a crucial barrier overnight Wednesday, reaching $45,300, before falling as the broader market dipped in early trades after US markets opened.
Bitcoin Unaffected By Inflation Rates
Over the last 24 hours, BTC/USD has moved in a range of $43,402.81 – $45,398.91, exhibiting high volatility. Trading volume has climbed by 16.21% to $28.8 billion, while the overall market cap is around $860.47 billion dollars, leading in a 42% market dominance.
As investors analyzed new US inflation data, which came in at 7.5% year-over-year vs an expected 7.3%, the earlier decline took shape. Risky assets like crypto and equities have reacted negatively, with all eyes on the Federal Reserve’s upcoming rate hike in March.
BTC/USD steadies above $45k. Source: TradingView
Despite being 0.2% higher than predicted, rising inflation did not have the same favorable impact on risk assets like Bitcoin as it had in recent months.
The S&P 500 fell 0.23%, the Nasdaq composite fell 0.18%, and the Dow Jones Industrial Average remained barely above the flat line.
According to analysts, the Federal Reserve may now have additional motivation to begin raising interest rates sooner due to the speed of year-over-year price increases.
Crypto trader and analyst Michael van de Poppe observed:
“The Consumer Price Index (CPI) results for the U.S.A. are coming in at 7.5% year-over-year, the expectations were 7.3% year-over-year.$DXY is shooting up and risk-on assets are dropping down like Bitcoin & equities.Likelihood that the FED will start rate hikes in March.”
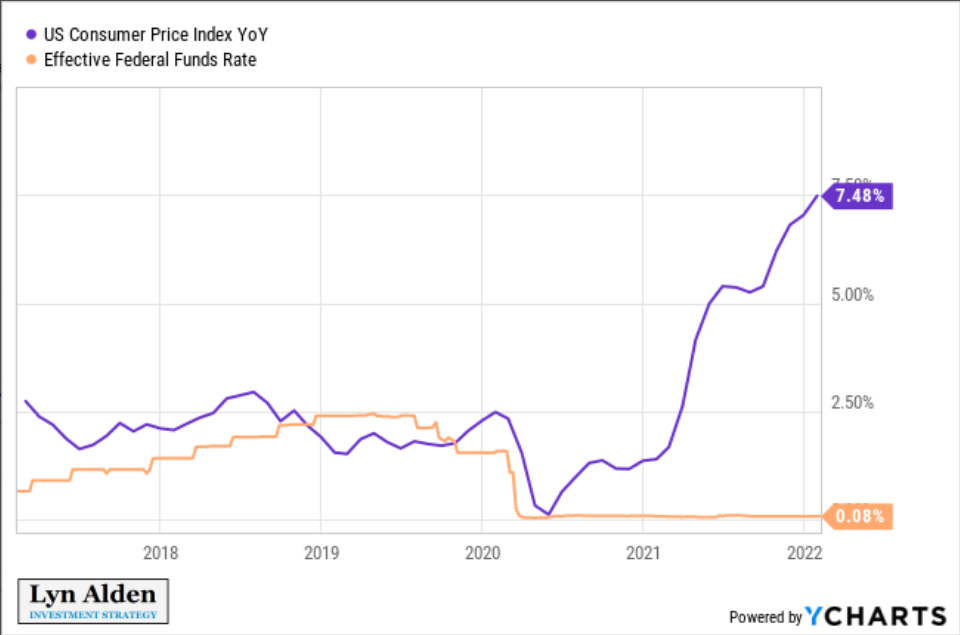
However, for economist Lyn Alden, it was cash savers who had been losing the most from inflation. she noted alongside a chart:
U.S. CPI vs. effective federal funds rate chart. Source: Lyn Alden/ Twitter
“Official inflation currently has its biggest gap over short-term interest rates since 1951. People holding cash in a bank or T-bills over the past year lost over 7% of their purchasing power.”
Related article | Investors Take Refuge In Bitcoin As Inflation Rises
BTC Will Hit $50k In Short term
The Fed will be put to the test here, as they had hoped for a steady tightening cycle rather than a hasty tightening that would appear to be a policy blunder. The political pressure on the Biden administration and Democrats will increase as core inflation rises over the Fed’s objective and real average hourly earnings fall. Although November is still a long way off, this inflation report shows that price hikes are everywhere, and there is rising opposition to new fiscal stimulus measures that would exacerbate pricing pressures.
As investors predict that pricing pressures may be peaking just before the Fed’s March policy meeting, US stocks have regained most of their inflation-related losses.
Given the rise in global bond yields, Bitcoin prices are holding up well. Bitcoin’s optimal future environment is risk appetite, which may be tough to achieve until after the Fed’s first couple of rate hikes. Institutional investors in Bitcoin are focusing on Treasuries because the momentum trade appears to be quite simple. For the short term, Bitcoin appears to be settling in between $40,000 and $50,000.
Cameron Winklevoss, co-founder of Gemini, feels Bitcoin is still the best inflation hedge, corroborating thoughts from the crypto community and even mainstream investors.
Inflation hit 7.5% in January. Highest in four decades. It continues to accelerate.
The best way to shield yourself from this pernicious, silent tax on your life’s work — your blood, sweat, and tears — is bitcoin.
By: Trent Fuenmayor, Program Manager, Coinbase Giving
Coinbase’s mission is to increase economic freedom in the world through the crypto-economy. To achieve this, it is essential to develop common infrastructure that is transparent, safe, secure, and benefits all participants. The open source community has provided critical support for Crypto development, with some support from donations from industry organizations and academic institutions. Our goal is to similarly support developers who are committed to growing and maintaining the Crypto ecosystem.
We launched our Crypto Community Fund in 2020 to aid this community effort, and in 2022 we’ve allocated up to $5M through Coinbase Giving, our philanthropic arm, to expand the program. Today, we have officially opened applications for our 2022 developer grants focused on blockchain developers who contribute directly to a blockchain codebase or researchers producing white papers addressing one or more of the following themes:
Eligibility and Preferences
Process
We will consider these applications on a rolling basis. Proposals will be shortlisted by current crypto developers and important community members. Coinbase will make the final decision.
We encourage all blockchain developers and prospective developers to apply for a Crypto Community Fund grant here.
This website contains links to third-party websites or other content for information purposes only (“Third-Party Sites”). The Third-Party Sites are not under the control of Coinbase, Inc., and its affiliates (“Coinbase”), and Coinbase is not responsible for the content of any Third-Party Site, including without limitation any link contained in a Third-Party Site, or any changes or updates to a Third-Party Site. Coinbase is not responsible for webcasting or any other form of transmission received from any Third-Party Site. Coinbase is providing these links to you only as a convenience, and the inclusion of any link does not imply endorsement, approval or recommendation by Coinbase of the site or any association with its operators.
Chinese entertainment conglomerate Tencent has been approved by the United Nations to lead a project exploring the creation of a standard technical and security framework for non-fungible tokens (NFTs) .
The project, dubbed a “technical framework for DLT-based digital collection services” will be the world’s first U.N.-approved standards initiative for NFTs, according to state-owned local media.
The U.N. agency for information and communication technologies, The International Telecommunication Union (ITU) approved the project, which is expected to complete an initial draft by the end of 2022, according to a report from the South China Morning Post.
Currently, any recommendations advised by the ITU only become mandatory and enforceable when nations adopt them as law.
“The international standard aims to specify the technical architecture, technical flows, functional requirements, and security requirements for blockchain-based digital collectibles,” wrote Tencent in a statement released on Tuesday.
“It could help drive a consensus and common understanding around the world on the formation of a technical framework for digital collection services.”
Meanwhile, the Chinese government is in the process of developing its own state-backed Blockchain Services Network (BSN).
This will help the Chinese Government to support the deployment of NFT projects unrelated to cryptocurrency, which it banned once again in Sep 2021.
Tencent will collaborate with a number of other companies on the initiative, including Alibaba affiliate Ant Group, The Chinese Academy of Information and Communications Technology, Beijing University of Posts and Telecommunications and Zhejiang Lab.
Related: China aims to separate NFTs from crypto via new blockchain infrastructure
In China NFTs are often referred to as “digital collectibles” in order to avoid criticism from the anti-crypto media and government. For this reason, Chinese NFT-creators tend to avoid public or decentralized blockchains such as Ethereum or Solana, opting to create their collectibles on permissioned blockchains.
Despite the country’s apprehension for crypto, it’s clearly very keen on exploring potential use cases for blockchain technology.
At the end of last month, China announced the commencement of a national plan to expedite blockchain development and innovation across key areas including manufacturing, energy, government data sharing and services, law enforcement, taxation, criminal trials, inspection and cross-border finance.
The institutional crypto inflows rebounded last week after Bitcoin-related products attracted significant investment. In total, investors poured nearly $71 million into BTC investment products.
Last week, digital asset investment products saw inflows worth $85 million. In the past three weeks, total institutional inflows in crypto products have reached $133 million. Apart from Bitcoin, a wide range of altcoins have gained the attention of institutional investors recently.
Solana, Polkadot and Cardano witnessed inflows totaling $2.4 million, $2.2 million and $1.1 million, respectively. Digital asset Terra saw a massive spike in inflows last week. Despite the rising popularity of BTC, SOL, DOT, ADA and LUNA among institutional investors, Ethereum saw a bearish trend with outflows totaling $8.5 million in the previous week.
“Digital asset investment products saw inflows totaling US$85m last week, marking the 3rd week of inflows totaling US$133m, suggesting continued positive sentiment amongst investors. Total assets under management (AuM) now total US$52.4bn with January 24th marking the low point in the most recent run of negative sentiment. While Europe has seen inflows (US$10.3m), the majority has been from the Americas, particularly Brazil and Canada (US$75m),” CoinShares noted in its report.
Bitcoin AUM
Due to the market dip in December 2021 and January 2022, the overall value of global Bitcoin assets under management have declined substantially. According to the report from CoinShares, the total value of global BTC AUM reached $34.4 billion last week. Ethereum came in the second spot with almost $13 billion worth of assets under management.
“Bitcoin continues to lead the inflows with US$71m last week, the largest since early December with this 3-week run of inflows totaling US$108m. Volumes in Bitcoin investment products remained low last week at US$1.8bn versus US$3.4bn the previous week,” CoinShares added.
Yesterday, BTC jumped above the price level of $44,300 for the first time since 13 January 2022.
Bitcoin has already lost its footing above $44K after breaking the coveted point to much fanfare. The downtrend has not been significant in any way but the digital asset could still end up losing more ground before the end of the trading day. Nevertheless, it has been a good run for bitcoin coming out of the weekend. As the cryptocurrency has made its bottom above $43,000, what could be expected going forward?
Bitcoin In Four-Year Cycles
As bitcoin has settled above $43,000, looking at other metrics to figure out where the digital asset may be headed has become imperative. In this report, we take a look at bitcoin through 4-year cycles and what it has often meant for the asset. Four years is important to the movement of bitcoin given that things like halvings happen in such timeframes. But for this, we take a look at the monthly EMA50 and how it works as the last correctional support before takeoff.
Related Reading | TA: Bitcoin is Surging, Why Bulls Could Aim More Upsides
The monthly exponential moving average is calculated using the past 50 periods. It is used to obtain the average price at which an asset has been acquired over a 50-day period. Thus, making it a widely used support level.
Over the years, at four-year intervals, the monthly EMA50 has served to show the final correction support for bitcoin. The first time was between 2009 to 2013, a four-year period that ended with the monthly EMA50 working as the final correction support. The same happens between 2013 and 2017, 2017 and 2021, with the next happening between 2021 and 2025.
For each of these, the monthly EMA50 has always stopped highly than the previous four-year cycle. Likewise, the price of bitcoin has not gone below this point.
If this stays true, then bitcoin is likely forming its support higher than $30,000. Continuing on, this trend would put the price of the digital asset as high as $220,000 over the next four years.
EMA50 marks four-year cycles | Source: TradingView.com
BTC On The Charts
Long-term, bitcoin shows tremendous promise. With adoption expected to rise and supply on the decline, it would impose scarcity on the asset, making it even more valuable. However, in the short term, BTC continues to struggle price-wise.
Related Reading | The Bear Signal That Suggests Another Bitcoin Crash Is Coming
After fighting its way out of a bear trend, it remains up to the bulls to pull out from underneath the bears. Market sentiment is getting better but still remains mostly negative, making investors wary of putting more money into the market.
Bitcoin is now trading in the $43,500 territory at the time of this writing. It lost about $2K after bursting through $45,000 in the early hours of Tuesday. But it has begun to recover after falling near $43,000.
BTC slips to $43K | Source: BTCUSD on TradingView.com
Featured image from Tokeneo, charts from TradingView.com
In traditional finance, an arbitrage is an opportunity to make a positive gain with virtually no risk involved by taking advantage of pricing discrepancies that are present in the markets. These pricing discrepancies are an indication that some inefficiencies are present in the markets.
Arbitrageurs will exploit these opportunities to make a profit and thus remove the pricing discrepancies, bringing back the markets to a more efficient state.
Triangular arbitrage in TradFi
In FX markets, a typical arbitrage trade is the triangular arbitrage which involves at least 3 currencies:
This arbitrage would take advantage of any deviation in price between the above three pairs.
Here, in an efficient market, we should always have:
In this example:
Here, any deviation from this equilibrium will lead to an arbitrage opportunity. For example, if Euro was cheaper relative to USD.
Triangular arbitrage DeFi: Uniswap
Uniswap is a decentralized exchange venue that allows two kinds of activities:
Provide liquidity of a given pair of ERC-20 tokens
Swap one ERC-20 token for another ERC-20 token
For the remainder of the post, we will focus on the second version of Uniswap (Uniswap v2), first deployed in May 2020. And since we are interested in triangular arbitrage, let us first explain how a swap is priced.
Uniswap belongs to the category of “constant-product market”. In this category, the product of the liquidities of the two ERC-20 tokens in the pair of interest is constant:
For illustration purposes, say token A is WETH while token B is USDC, and we have in the WETH-USDC pool 1,000 WETH and 3,000,000 USDC. Then,
Assume now that we want to swap 1 WETH to USDC, how much USDC can we obtain? Our trade would increase the liquidity for WETH to 1,001 WETH. In order to maintain the constant product, we have:
So the amount of USDC that we receive in the swap is:
So in our swap, we receive an effective WETH/USDC rate of 2,997.
A few things to note here:
This example doesn’t include fees to focus on the pricing.
The effective WETH/USDC rate can change when we swap a different amount of WETH. This is called slippage. In this example, the effective price “slipped” by 3 USDC or 0.1%.
Our WETH/USDC rate is purely determined by the liquidities available in the venue and is not dependent on how WETH/USDC is quoted on other venues. This is yet another possible source of arbitrage, albeit one that is beyond the scope of this post.
Triangular arbitrage opportunities in Uniswap v2
Based on the discussion so far on both triangular arbitrage and Uniswap, a natural question is how prevalent triangular arbitrage opportunities are in Uniswap v2. We try to answer this question indirectly by analyzing Uniswap v2 swap trades that take advantage of triangular arbitrage opportunities. More specifically, we focus on the following characteristics:
All the trades are executed in the same transaction to reduce the risk of prices moving and affecting the arbitrage opportunities.
All the trades involve only Uniswap v2. With this, we miss triangular arbitrage trades that involve multiple venues (e.g. simultaneous swaps on Uniswap and Sushiswap).
All the tokens involved in the trades offset except for one token: the gain token, for which the sender will gain more at the end of the trade series.
After analyzing over 68 million Uniswap v2 swaps since Uniswap v2 was deployed until the end of 2021, we found 1,371,122 swaps grouped in 429,315 transactions taking advantage of triangular arbitrage opportunities in Uniswap v2.
On a monthly basis, we see a pronounced peak in October 2020, while the number of trades taking advantage of triangular arbitrage opportunities have been decreasing since. There are many factors that might have caused this (rise of competing DEXes, arbitrage opportunities mechanically decreasing due to the market becoming more efficient…). We are currently exploring these leads to try and explain this behavior.
Next, we see which tokens are most often used as gain tokens. WETH is the clear front runner here with 417,229 trades. 2nd-4th place are occupied by stablecoins: USDC, USDT, DAI. In total, we identified 123 distinct tokens used as gain tokens, but the top four tokens account for more than 99% of the trades.
How many legs were typically used to trade these opportunities? A majority of these trades were done using three legs. Quite a significant number also involved up to 6 legs.
How profitable are these trades? For WETH, a high proportion of the 417,229 trades involving WETH are profitable (about 94% when accounting for gas). The most profitable trade gained around 280 WETH, but the average and median gas-adjusted gains are much smaller (average: 0.08 WETH, median: 0.012 WETH).
For USDC, the trade with the most gain accumulated more than 14,000 USDC, but on average, the gain was around 97 USDC, while the median gain was almost 28 USDC.
Let us now consider the individual addresses (without revealing any specific ones) behind these trades. We found that these trades were initiated by 4,784 unique addresses, the most active of which initiated more than 16,000 trades. In total, 94 unique addresses initiated more than 1,000 trades each. When using WETH as the gain token, the most profitable address managed to accumulate more than 1,100 WETH as a result of its trades; in the case of USDC as the gain token, the most profitable address accumulated almost 35,000 in USDC.
Arbitrage trade execution
Last but not least, let us now discuss at a high level how these triangular arbitrage opportunities are detected and how the corresponding trades are executed.
We need to monitor the prices, likely using an automated process, in the Uniswap v2 pools. Given the prices for various pairs, an algorithm can run a search to see which combinations of pairs give rise to triangular arbitrage opportunities, potentially also incorporating opportunities identified from pending transactions in the mempool.
Once opportunities are identified, then we move to the execution aspect. One key consideration is minimizing slippage, and it naturally leads toward having the swaps being executed within a single transaction. Another consideration is avoiding front-running or sandwich attacks, for which Flashbots Auction can be beneficial.
Future directions
Here, we have just scratched the surface in terms of understanding and maximizing the potential of decentralized finance. We, as part of the Data Science Quantitative Research team, aim to get a good holistic understanding of this space from a quantitative perspective that can be used to drive new Coinbase products. We are looking for people that are passionate in this effort, so if you are interested in Data Science and in particular Quantitative Research in crypto, come join us.
The analysis makes use of the Uniswap v2 subgraph made available through the Graph Protocol. Thanks to Luke Youngblood and Xavier Lu for their contribution and feedback.
As Bitcoin (BTC) and altcoins took a break from reaching new all-time highs, the market sentiment seems gloomy since the start of 2022. However, while the market seems to be sleeping, its trajectory shows that there’s more to look forward to in the coming months.
Multinational professional services network KMPG published its biannual Pulse of Fintech report, where the firm tracks and analyzes developments and investments within the financial technology sector. The report highlighted the most notable developments in major regions like the Americas, Asia Pacific and EMEA, and pointed out the “surging interest” in crypto and blockchain in the past year.
While the scope of the report covers a broader context, crypto and blockchain remained as one of the key topics. Here are the main takeaways from the Pulse of Fintech report by KPMG.
Over $30 billion in investments entered crypto and blockchain
From the $5.5 billion amassed in 2020, investments in the crypto and blockchain space rose to more than $30.2 billion in 2021. This shows that more companies have recognized that crypto and its technologies have potential roles to play in modern financial systems.
Brian Heaver, KPMG US Managing Director thinks that 2021 is very significant for crypto when it comes to adoption.
“There’s an incredible number of companies trying to do a lot of things in the crypto and blockchain space right now — and while we don’t know where all their efforts are going to land, there’s a ton of curiosity and interest in the possibilities.”
Regtech focused on crypto despite the shift in Asia-Pacific
Despite the outright crypto ban in China, technologies that help regulate crypto have been “a relatively hot area of investment” according to KPMG. The firm predicts that there may be more investments to come in regulation technology (regtech) solutions focusing on cryptocurrencies in the future.
This may also make its way to Europe according to KPMG International’s Global Head of Regtech, Fabiano Gobbo.
“While the US continued to attract the vast majority of investments in regtech, Europe is well-positioned to see growth heading into 2022.”
Related: Global crypto adoption could ‘soon hit a hyper-inflection point’: Wells Fargo report
Blockchain use cases are growing
In 2021, as investors started to become more familiar with blockchain, interest in its various use cases has also grown. According to KPMG, the “universe of blockchain applicability” has expanded in 2021. The year spurred more interest in a wide range of blockchain applications, including multi-jurisdictional blockchain uses cases for data, research and analysis.
Because of this, the firm also predicts that crypto will attract “investors of all types” including retail investors as well as corporate and institutional investors because of the increase in use cases.
Singapore-based crypto investments grew more than tenfold
As previously reported by Cointelegraph, crypto investments in Singapore grew very significantly in 2021. The global crypto hub recorded a whopping $1.48 billion in crypto-focused investments last year. This wildly surpasses its previous record in 2020 which was $110 million. The region’s crypto investments accounted for 5 percent of the total global investments in crypto in 2021. It also makes up a third of all investments in the fintech sector throughout the country.
KPMG Singapore’s Head of Financial Services Advisory Anton Ruddenklau thinks that Singapore attracted investors that were previously looking into China, but are pushed away because of the crypto bans.
“Singapore and India could be big winners on the investment front as investors and companies that might have gone to China look for opportunities elsewhere in the region.”
It’s been a rough start to 2022 for crypto investors. Bitcoin (CCC:BTC-USD) has witnessed meaningful correction and altcoin have followed.
Unrest in Kazakhstan has resulted in Bitcoin network power slumps and that’s one reason for the correction. Further, the Federal Reserve has signaled tapering and rate hikes are coming in 2022. Relative tightening of liquidity is another reason for some weakness in the crypto world.
However, volatility is nothing new in the crypto space. In the past, Bitcoin has witnessed sharp correction. It has been followed by a strong reversal rally. I also believe that we are at a point where Bitcoin dominance is likely to decline on a relative basis.
Altcoin dominance will increase and the out-performers will be coins that have a strong use case. In uncertain times, meme coins or low utility coins are likely to be the worst hit.
Overall, real interest rates are likely to remain negative in most parts of the world. Even if contractionary monetary policies are pursued. This will continue to encourage investment and speculation in risky asset classes.
I therefore believe that the recent correction is a good opportunity to accumulate some quality altcoins.
Let’s discuss seven cryptos that are positioned for a strong rally in the near-term. These altcoins are also likely to remain in an uptrend in the coming quarters.
Binance Coin (CCC:BNB-USD)
Zignaly (CCC:ZIG-USD)
MarketMove (CCC:MOVE-USD)
MarhabaDeFi (CCC:MRHB-USD)
Torum (CCC:XTM-USD)
Fetch.ai (CCC:FET-USD)
Rari Governance Token (CCC:RGT-USD)
Source: Robert Paternoster / Shutterstock.com
In October 2017, BNB coin was trading at three cents. The coin touched all-time highs of $686 in May 2021. This serves as a good example of the value creation that’s likely to come by holding fundamentally strong projects.
After being a star performer in 2021, BNB coin has been in a downtrend in the recent past. At current levels of $487, it’s worth buying for short-term and long-term gains.
As an overview, Binance is the top centralized cryptocurrency exchange in the world. The exchange currently has 355 listed coins as compared to 139 coins listed on Coinbase (NASDAQ:COIN). For investors who are bullish on continued adoption growth of cryptocurrencies, BNB coin is a core portfolio hold.
Last month, Binance partnered with Dubai World Trade Centre. The partnership will set up an international virtual asset ecosystem. In December 2021, Binance also acquired 18% stake in Singapore based regulated private exchange, Hg Exchange.
It seems that Binance has ample financial flexibility to pursue acquisition driven growth. Further, Binance Labs has been investing in attractive projects in the crypto world. Once bullish sentiments are back, it would not take long for BNB coin to surge.
Source: Shutterstock
I had talked about Zignaly in October 2021 as a project that has a strong use case. From November 2021 lows of two cents, ZIG coin is already higher by over 280%. As a matter of fact, the coin had touched highs of 18 cents in the recent rally. I believe that ZIG coin is worth accumulation with the market sentiment driving the coin lower.
The recent market volatility and downside has further underscored the importance of Zignaly project in the cryptocurrency ecosystem. The idea of Zignaly is to follow trading experts for profits. The platform has already gained significant traction with 350,000 users and $120 million in assets under management.
It’s worth mentioning here that Zignaly profit-sharing and trading has an edge over copy trading. In the latter, the user is always one-step behind the trader. However, in profit-sharing, the user is a co-investor with the trader. Zignaly claims that the top 20 traders on the platform delivered 270% annual profits. Therefore, just by profit sharing with these traders, investors can make meaningful gains.
I particularly like the project as there are thousands of new investors taking a plunge into cryptocurrencies on a daily basis. It makes sense to test the waters with an expert before pursuing individual trading.
Source: Shutterstock
In the last two-weeks, Bitcoin has trended lower. However, during the same period, MOVE token has been in an uptrend.
MarketMove is another project that I have talked about in the past. However, the project is undergoing a complete revamp with Move X slated to be launched in the second week of January 2022. This is a key reason for MOVE token to trend higher.
MarketMove project started with a focus on artificial intelligence (AI)-driven Safety Audit of projects. Further, the project aimed at bringing features like stop-loss and limit orders in decentralized finance.
However, with the coming launch of Move X, the project vision seems to have widened. While the whitepaper is still to be unveiled, Move X swap will be cross-chain and allow investors the best swap rates, which will be powered by artificial intelligence. Therefore, the idea is not just to provide a platform to exchange assets (across chains), but to exchange at the best possible rates.
Additionally, Move X intends to differentiate itself from other DeFi projects by being a complete suite of high-end tools. As an example, the project aims to provide investors with suggestions on how to earn using staking and farming across blockchains.
Overall, MarketMove project is just two quarters old. It seems that the team has a vision of making the project a one-stop shop for all DeFi needs. In my view, some exposure to the project can be considered for potential multi-fold returns.
Source: Shutterstock
MRHB is another token in the crypto space that has survived the recent carnage. On Dec. 27, the token was trading at four cents. It’s already higher by over 200% at 13 cents.
So, what’s the differentiating factor?
MarhabaDeFi claims to be the first project in the decentralized world that builds a shariah-compliant suite of crypto financial solutions. According to CoinGecko, the project is focused on “Islamic Finance liquidity pool which is currently over $3 trillion in size, growing, and serves over 1,000,000 people globally”
Liquidity Harvester is one feature of MarhabaDeFi. It’s for income generation across a vast range of sharia compliant pools that will deliver APY in the range of 5% to 25%. The project also has a cross-chain DEX Aggregator that splits large orders across various decentralized exchanges to reduce the slippage. The launch of interest-free crypto financing is also on the cards in 2022.
With a lot happening in the NFT space, MarhabaDeFi has introduced Souq NFT. This is a NFT collection and creation platform. It also includes listing and auction marketplace.
Overall, MRHB token looks attractive with a diversified offering in an unexplored area of Islamic finance merging with the crypto world. It’s not surprising that the coin has been trending higher even as broad markets decline.
Source: Shutterstock
XTM coin has been in a correction mode in the recent past. However, it’s worth noting that XTM is still higher by 700% from lows of October 2021. The coin has therefore witnessed a meaningful rally. I believe that the correction provides a good entry point for long-term investors.
As an overview, Torum is the first social media platform that’s specifically designed for cryptocurrency users. According to the website, the social media platform already has 203,361 users. With a global reach, it’s likely that Torum users will continue to increase.
Further, there are few factors that are likely to support user growth as the project visibility increases.
First and foremost, the platform rewards users for activities that include posting, liking posts and for creating threads on specific topics. Users are rewarded XTM coins. This provides an incentive to remain active on the social media platform.
Furthermore, Torum is expanding beyond just social media. The project already serves as a news aggregator in the crypto space. Additionally, NFT Marketplace and NFT Launchpad are catalysts for sustained user growth in the social media platform. Besides the launchpad, the Torum DeFi also provides investors with liquidity farming and cross-chain swapping.
Another interesting upcoming feature of the project is Torumgram. This will connect Telegram with Torum, “essentially allowing the community to use Telegram directly on Torum.”
Source: Shutterstock
Fetch.ai project is another name that comes with a strong use case. The project aims to bring the application of machine learning and artificial intelligence to the decentralized world.
FET token has been an out-performer in the last 12-months. Even after the recent decline, the token is higher by 550% over this period.
In terms of the use case, Fetch.ai has applications in areas that include smart city, decentralized delivery agents and autonomous AI travel agents, among others. Last year, the project developed a decentralized marketplace for global manufacturer, Festo.
In particular, the smart city project promises significant reduction in carbon footprint. With rising environmental concerns, this can be a game-changer. Fetch.ai estimates that the “implementation of smart-city infrastructure will result in 34,000 tonnes Co2 emission reduction annually.”
In March 2021, Fetch.ai also received institutional investment of $5 million. This will help in building and accelerating the company’s AI application. Among the project partners, there are big names like Bosch and Blockchain for Europe.
Overall, FET token looks attractive below 50 cents and is worth considering for the medium to long-term.
Source: Shutterstock
As the world of decentralized finance swells, RGT token is worth holding for the long-term.
The token had touched all-time highs of $64.6 in November 2021. After a meaningful correction, the token currently trades at $26.88. With a limited supply of 12.5 million tokens, I am bullish on RGT touching new highs once the sentiments reverse for cryptocurrencies.
As an overview, Rari Capital is involved in lending, borrowing and yield generation in the DeFi space. For Rari, growth has been stellar in the last 12-months.
Currently, the community has more than 10,000 members with a total value locked of $1.1 billion. Rari Capital provides more than 100 DeFi opportunities.
It’s worth noting that even with a potential rate hike in 2022, real interest rates will remain negative. Rari allows investors to deposit crypto-assets and earn a robust yield. It’s therefore very likely that the total value locked in DeFi opportunities in the project will continue to swell.
This will translate into upside for the governance token that looks undervalued. To put things into perspective, the project currently has fully diluted valuation to total value locked ratio of 0.33.
On the date of publication, Faisal Humayun did not hold (either directly or indirectly) any positions in any of the securities mentioned in this article. The opinions expressed in this article are those of the writer, subject to the InvestorPlace.com Publishing Guidelines.
Faisal Humayun is a senior research analyst with 12 years of industry experience in the field of credit research, equity research and financial modelling. Faisal has authored over 1,500 stock specific articles with focus on the technology, energy and commodities sector.
The post 7 Killer Cryptos to Buy for January appeared first on InvestorPlace.
The Federal Financial Supervisory Authority in Germany (BaFin) issued a warning on crypto trading advice on social media. Although there was no direct reference to social media channels, Telegram is one of these sources.
BaFin did provide its principals for any investor that wishes to use social media for investment tips.
BaFin’s Advice on Social Media Tips
The number of followers, likes or positive feedback are not valid indicators. They do not reflect the performance of the investment tips. It is very easy to manipulate results in social media. Positive feedback or references related to investment success stories can be fictionized and produced at the author’s request.
Investment tips are often marketed aggressively on social media. The goal is to make investors have ‘fear of missing out’ (FOMO) and push them into making poor decisions. Always check the investment advice to ensure the risks and opportunities are fully understood.
Investment advice on social networks is mostly free. This means that the author is compensated through other sources. Most of the time they earn a commission from the broker that its products are advertised on social media. For regular users, it is difficult to detect. Bear in mind that with such commission models there can be an ulterior motive for the individual providing the advice.
There is no ‘fast money’ that is ‘100% safe.’ If you are promised high profits rest assured that the risk is extremely high. The financial products that may offer such returns are highly speculative on most occasions. This can result in significant loss including losing the entirety of invested capital.
Caution is advised if only success stories are highlighted without the risk involved.
‘Pump and Dump’
There are dedicated Telegram groups that ‘pump and dump’
cryptocurrencies
Cryptocurrencies
By using cryptography, virtual currencies, known as cryptocurrencies, are nearly counterfeit-proof digital currencies that are built on blockchain technology. Comprised of decentralized networks, blockchain technology is not overseen by a central authority.Therefore, cryptocurrencies function in a decentralized nature which theoretically makes them immune to government interference. The term, cryptocurrency derives from the origin of the encryption techniques that are employed to secure the networks which are used to authenticate blockchain technology. Cryptocurrencies can be thought of as systems that accept online payments which are denoted as “tokens.” Tokens are represented as internal ledger entries in blockchain technology while the term crypto is used to depict cryptographic methods and encryption algorithms such as public-private key pairs, various hashing functions, and an elliptical curve. Every cryptocurrency transaction that occurs is logged in a web-based ledger with blockchain technology.These then must be approved by a disparate network of individual nodes (computers that maintain a copy of the ledger). For every new block generated, the block must first be authenticated and confirmed ‘approved’ by each node, which makes forging the transactional history of cryptocurrencies nearly impossible. The World’s First CryptoBitcoin became the first blockchain-based cryptocurrency and to this day is still the most demanded cryptocurrency and the most valued. Bitcoin still contributes the majority of the overall cryptocurrency market volume, though several other cryptos have grown in popularity in recent years.Indeed, out of the wake of Bitcoin, iterations of Bitcoin became prevalent which resulted in a multitude of newly created or cloned cryptocurrencies. Contending cryptocurrencies that emerged after Bitcoin’s success is referred to as ‘altcoins’ and they refer to cryptocurrencies such as Bitcoin, Peercoin, Namecoin, Ethereum, Ripple, Stellar, and Dash. Cryptocurrencies promise a wide range of technological innovations that have yet to be structured into being. Simplified payments between two parties without the need for a middle man is one aspect while leveraging blockchain technology to minimize transaction and processing fees for banks is another. Of course, cryptocurrencies have their disadvantages too. This includes issues of tax evasion, money laundering, and other illicit online activities where anonymity is a dire ingredient in solicitous and fraudulent activities.
By using cryptography, virtual currencies, known as cryptocurrencies, are nearly counterfeit-proof digital currencies that are built on blockchain technology. Comprised of decentralized networks, blockchain technology is not overseen by a central authority.Therefore, cryptocurrencies function in a decentralized nature which theoretically makes them immune to government interference. The term, cryptocurrency derives from the origin of the encryption techniques that are employed to secure the networks which are used to authenticate blockchain technology. Cryptocurrencies can be thought of as systems that accept online payments which are denoted as “tokens.” Tokens are represented as internal ledger entries in blockchain technology while the term crypto is used to depict cryptographic methods and encryption algorithms such as public-private key pairs, various hashing functions, and an elliptical curve. Every cryptocurrency transaction that occurs is logged in a web-based ledger with blockchain technology.These then must be approved by a disparate network of individual nodes (computers that maintain a copy of the ledger). For every new block generated, the block must first be authenticated and confirmed ‘approved’ by each node, which makes forging the transactional history of cryptocurrencies nearly impossible. The World’s First CryptoBitcoin became the first blockchain-based cryptocurrency and to this day is still the most demanded cryptocurrency and the most valued. Bitcoin still contributes the majority of the overall cryptocurrency market volume, though several other cryptos have grown in popularity in recent years.Indeed, out of the wake of Bitcoin, iterations of Bitcoin became prevalent which resulted in a multitude of newly created or cloned cryptocurrencies. Contending cryptocurrencies that emerged after Bitcoin’s success is referred to as ‘altcoins’ and they refer to cryptocurrencies such as Bitcoin, Peercoin, Namecoin, Ethereum, Ripple, Stellar, and Dash. Cryptocurrencies promise a wide range of technological innovations that have yet to be structured into being. Simplified payments between two parties without the need for a middle man is one aspect while leveraging blockchain technology to minimize transaction and processing fees for banks is another. Of course, cryptocurrencies have their disadvantages too. This includes issues of tax evasion, money laundering, and other illicit online activities where anonymity is a dire ingredient in solicitous and fraudulent activities. Read this Term. These groups coordinate their trades, targeting low-volume cryptocurrencies. When the price jumps higher, investors that are unaware of the scheme buy the cryptocurrency. The groups’ members then sell their cryptos for a hefty profit.
The Australian Securities and Investments Commission (
ASIC
ASIC
The Australian Securities and Investments Commission (ASIC) is the prime regulator in Australia for corporate, markets, financial services, and consumer credit. It is empowered under the financial service laws to facilitate, regulate, and enforce Australian financial laws. The Australian Commission was set up and is administered under the Australian Securities and Investment Commission Act of 2001. ASIC was initially the Australian Securities Commission based on the 1989 ASC Act. Initially, the idea was to unite regulators in Australia by replacing the National Companies and Securities Commission and the Corporate Affairs offices. ASIC does not regulate business or register business structures, only business names. One of the unique features of the Australian regulator is that over 90% of its operating budget comes from fees and fines levies. These fees for service, including company registration fees and licensing fees for banks, brokers, and other financial institutions. What is ASIC Responsible For?The regulator is charged with protecting the public from financial fraud and to make sure the investor is knowledgeable and understands their involvement. To this end, the Commission provides a license to each Financial Services provider. ASIC tests and assesses the qualification and experience of Financial Advisors. An Australian financial services (AFS) licensee, an authorized representative, employee or director of an AFS licensee, or an employee or director of a related body corporate of an AFS licensee, is authorized to provide personal advice to retail clients concerning relevant financial products to retail clients ASIC monitors the behavior of Financial Advisors and can access fines and remove or suspend their license. The regulator also licenses all investment and trading companies doing business in Australia. One service of the most outstanding benefits is the Australian Market Regulation Feed. To monitor trading activity, brokers and market operators have to facilitate access to ASIC’s Integrated Market Surveillance System. This means brokers and other relevant bodies in the registry must allow daily access to: All orders, trades, and quotes that are processed and circulated by the trading engine All messages related to trading sessions, product price and status They are closely monitoring all online and day trading
The Australian Securities and Investments Commission (ASIC) is the prime regulator in Australia for corporate, markets, financial services, and consumer credit. It is empowered under the financial service laws to facilitate, regulate, and enforce Australian financial laws. The Australian Commission was set up and is administered under the Australian Securities and Investment Commission Act of 2001. ASIC was initially the Australian Securities Commission based on the 1989 ASC Act. Initially, the idea was to unite regulators in Australia by replacing the National Companies and Securities Commission and the Corporate Affairs offices. ASIC does not regulate business or register business structures, only business names. One of the unique features of the Australian regulator is that over 90% of its operating budget comes from fees and fines levies. These fees for service, including company registration fees and licensing fees for banks, brokers, and other financial institutions. What is ASIC Responsible For?The regulator is charged with protecting the public from financial fraud and to make sure the investor is knowledgeable and understands their involvement. To this end, the Commission provides a license to each Financial Services provider. ASIC tests and assesses the qualification and experience of Financial Advisors. An Australian financial services (AFS) licensee, an authorized representative, employee or director of an AFS licensee, or an employee or director of a related body corporate of an AFS licensee, is authorized to provide personal advice to retail clients concerning relevant financial products to retail clients ASIC monitors the behavior of Financial Advisors and can access fines and remove or suspend their license. The regulator also licenses all investment and trading companies doing business in Australia. One service of the most outstanding benefits is the Australian Market Regulation Feed. To monitor trading activity, brokers and market operators have to facilitate access to ASIC’s Integrated Market Surveillance System. This means brokers and other relevant bodies in the registry must allow daily access to: All orders, trades, and quotes that are processed and circulated by the trading engine All messages related to trading sessions, product price and status They are closely monitoring all online and day trading Read this Term) has been cracking down on these groups.
Cryptocurrencies are seeing a significant recovery as investors take advantage of the recent stock market rally and increased risk appetite. Bitcoin hits its highest in two weeks, extending gains from earlier this week that had seen it climb to $41,938 per coin on Saturday morning (Jan 24th).
Related Reading | Bitcoin mimics stocks rally, hits two-week high
Bitcoin, the largest digital currency globally, has hit $41,938. It is 16% high from Thursday’s low and 27% from the current year’s low of $32,950.
Bitcoin price hits two weeks high of $41,938. Source: Tradingview.com
Ether, the second-largest digital currency, has scaled new heights, reaching $3K for the first time since January 21.
Bitcoin recorded its biggest single-day gain since mid-June as fears of faster than expected Fed rate hikes led to an increase in inflation, with the cryptocurrency also being roiled by technological innovation. However, Friday’s 11% rise was enough to consider haven against this trend and get some positive press at least until Monday when everything will likely go back down again.
Bitcoin Price Recovery: Thanks to Amazon
Despite a long week of volatility from earnings, US stocks ended the week strong. The tech-heavy NASDAQ secured gains thanks to Amazon’s robust growth and Facebook owner Meta Platforms’ disappointing results that evening gave them more confidence in their business models moving forward.
Related Reading | Amazon Strong Growth Attributed to the Cloud Despite Retail Headwinds
Bitcoin has moved seamlessly into the mainstream. That resulted in investors looking to get in on the action when risk appetite is low. Ed Hindi, Chief Investment Officer of Tyr Capital, said;
“The current panic and volatility surrounding bitcoin are based on a fundamental misunderstanding of it as an asset class. When valuations on the Nasdaq fall, misguided institutional investors start liquidating bitcoin positions en masse as if it were a tech stock.”
The recent rise in the stock market has given other listed crypto assets a boost. As a result, some currencies even reached new highs.
BTC Price Prediction
Though prices for Bitcoin have seen a significant drop in the last week of January and were sitting at 47% of their all-time high, the cryptocurrency recovered slightly after reaching a low of $33K on Jan 24, 2022, and is worth about $42k.
Buy, sell and hold? Analysts are split on whether or when to buy cryptocurrency. But more than half believe this is a good time for buyers, with only 45% disagreeing.
The experts from the top fintech companies predict that by the end of 2022, bitcoin will reach an all-time high of $93,717 – more than 24K dollars higher than its current all-time high price.
This is a great time to invest in cryptocurrency. Experts predict that by the end of 2025, bitcoin will trade at $192k and mount up over 300% from its November 2021 peak and reach nearly half a million dollars by 2030. While these predictions may seem lofty goals at first glance, they’re significantly less than what experts predicted back in July 2021 when their last forecast said bitcoins prices could reach 265k or 706K, respectively.
Featured image from Pixabay, chart from TradingView.com
Lorsque vous explorez les différentes options de jeux en ligne, Spin Million Casino se distingue par son offre exceptionnelle de bonus et de promotions. Les joueurs expérimentés apprécieront non seulement la diversité des jeux disponibles, mais également les opportunités de gains qui se présentent à eux. Par exemple, ce casino offre des bonus de bienvenue attractifs qui augmentent considérablement votre capital de jeu dès le départ.
En outre, les options de paris sont variées, allant des machines à sous aux jeux de table en passant par le live casino. Les amateurs de jeux de table trouveront des versions classiques comme le blackjack et la roulette, tandis que les fans de machines à sous pourront profiter de jeux avec des thèmes et des fonctionnalités innovantes. Les jackpots progressifs ajoutent une couche d'excitation supplémentaire, offrant des gains potentiels qui peuvent changer la vie.
Les plateformes de jeu comme Yonibet
Lorsque vous recherchez un casino en ligne fiable, Yonibet est une option à considérer sérieusement. Ce casino a su établir une réputation solide grâce à sa large gamme de jeux, y compris des options de paris sportifs et des machines à sous captivantes. Les bonus offerts sont également un point fort, permettant aux joueurs de maximiser leurs mises et d'explorer de nouveaux jeux sans risque.
De plus, la légalité de ce casino est un autre aspect crucial. Yonibet opère sous une licence respectée, garantissant que toutes les transactions et les jeux sont effectués en toute sécurité. Les joueurs peuvent donc se concentrer sur l'essentiel : profiter de l'expérience de jeu. Les fonctionnalités telles que le live casino permettent une immersion totale, avec des croupiers en direct et une interaction en temps réel qui enrichissent l'expérience.
Roobet Casino : une expérience de jeu unique
Pour ceux qui recherchent une expérience de jeu différente, Roobet Casino offre une plateforme innovante qui attire les joueurs du monde entier. L'interface conviviale et les jeux variés en font un lieu de divertissement idéal pour les parieurs avertis. Les bonus réguliers et les promotions spéciales renforcent l'engagement des joueurs, leur permettant de maximiser leur expérience.
Les options de paris sont étendues, avec une section de paris sportifs bien développée qui attire de nombreux passionnés. Les jeux de casino sont également bien représentés, avec des machines à sous excitantes et des jeux de table classiques. L'accent mis sur la sécurité et la légalité est primordial pour Roobet, ce qui permet aux joueurs de profiter de leurs sessions de jeu en toute tranquillité d'esprit.
Cashwin : le choix des joueurs avertis
Enfin, Cashwin se présente comme un choix incontournable pour les joueurs à la recherche de bonus généreux et d'une sélection de jeux de qualité. Avec une interface fluide et des options de paiement variées, ce casino s'efforce de fournir une expérience de jeu optimale. Les promotions régulières et les programmes de fidélité récompensent les joueurs, ajoutant une dimension supplémentaire à leur aventure de jeu.
Cashwin se démarque également par son engagement envers la légalité et la sécurité. Les joueurs peuvent être assurés que leurs informations personnelles et financières sont protégées. Que ce soit pour des paris sportifs ou des jeux de casino, Cashwin offre un environnement sécurisé où l'amusement et le potentiel de gains sont au rendez-vous.